Identify wells for reactivation and underperformance.
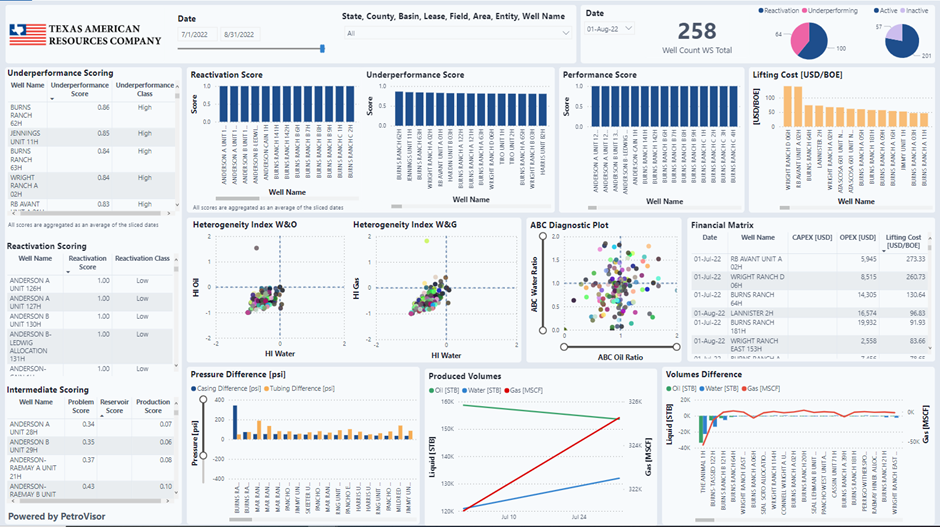
Identification of underperforming wells is a crucial step as early detection of such wells may improve the economics. Current workflow screens all the wells based on their historical problems and production potential: the detected problems and risks associated with water problems, heterogeneity index, after before compare (ABC) plots etc.
The decision tree from Figure 1 shows the workflow for ranking the wells according to their performance.
Performance Score
The final scores are the weighted sum of the underlying input features as follow
W1*Problem Score + W2*Production Score + W3*Economical Score
The weights can be customized as per customer preference as some client might prefer to give more weight to the economic data while other focus more on the technical score, however a default weight values can be used for the calculations (W1=0.2, W2=0.4 and W3=0.4).

Note that weights are changeable and can be replaced with signals for optimization purposes. The reactivation and shut in scores are the weighted sum of the underlying input features and intermediate scores:
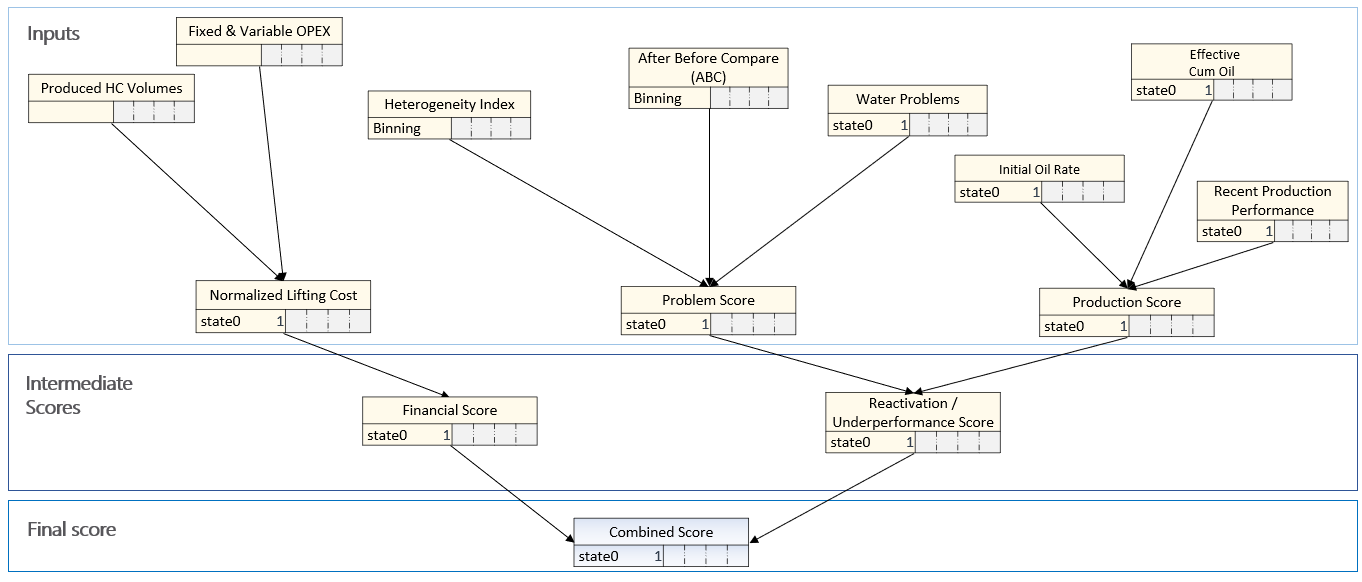
Figure 1 Combined scoring using financial and technical metrics
Reactivation Score = W1*Production Score + W2*Problem Score
W1 = 0.7
W2 =0.3
Reactivation Candidates have high scores. Reactivation Candidates are all Inactive wells.
Underperformance Score= W1*Production Score + W2*Problem Score
W1 = 0.7
W2 =0.3
Underperforming Candidates have high scores. Underperforming Candidates are all Active wells.
ABC Analysis
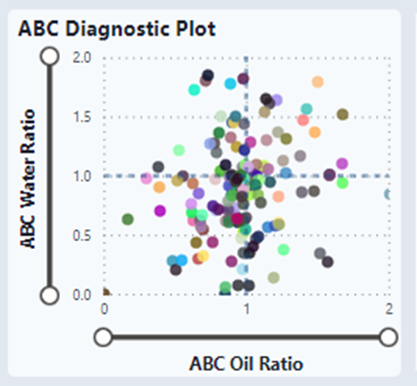
The ABC analysis (After Before Compare) is used to evaluate the performance of all wells in a reservoir on a short term (3 months apart) based on the relative change of oil rate and water rate. For oil producers in a reservoir with water flooding, the ratio of the current water rate to the previous water rate is plotted on the X axis while that of the current oil rate to the previous oil rate is plotted on the Y axis.
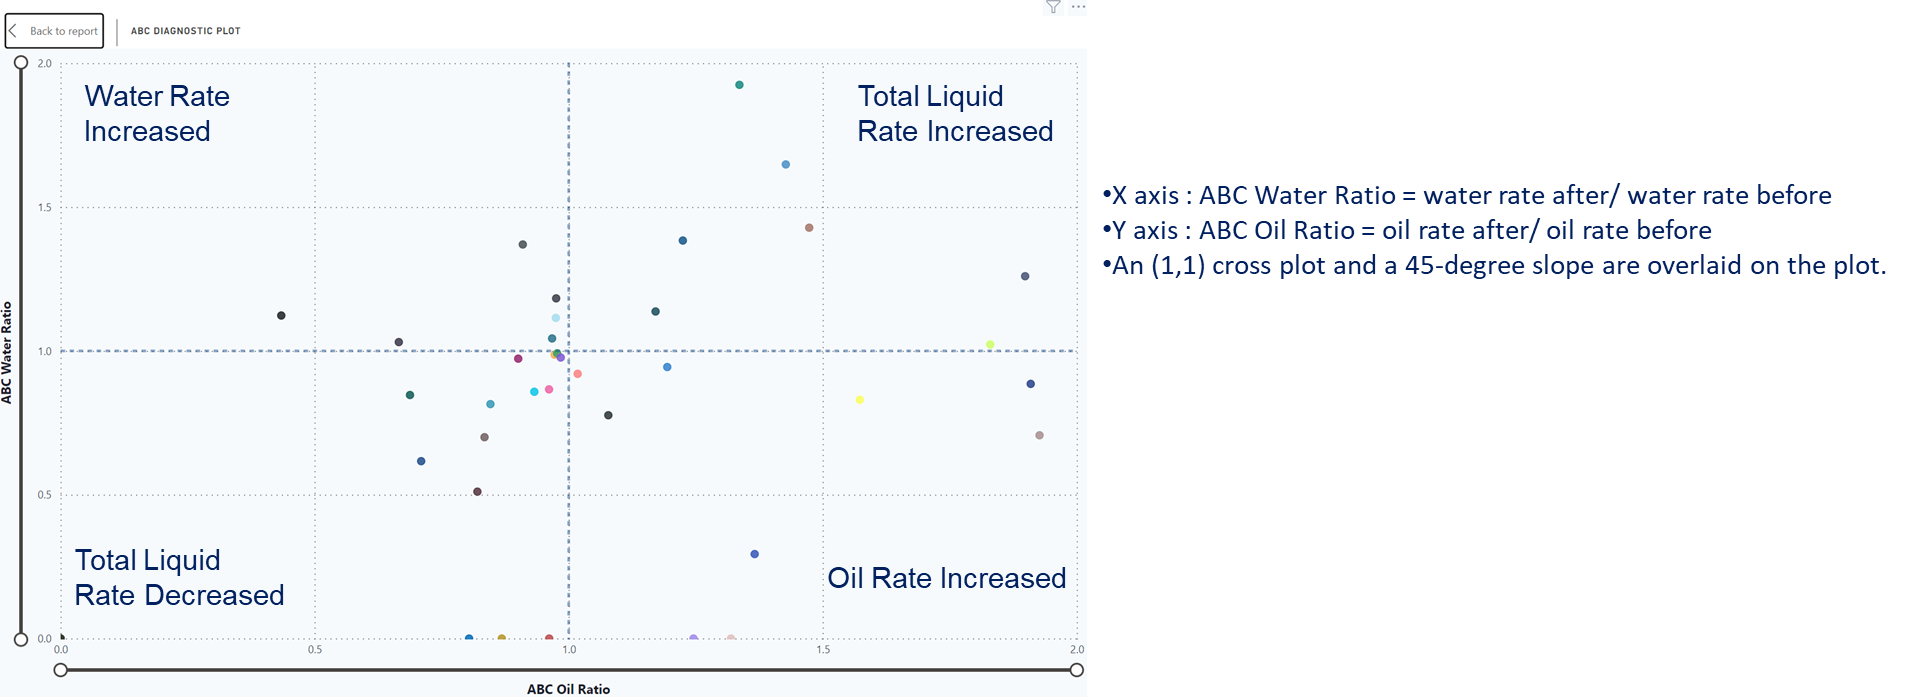
The ABC plot is characterized by 4 quadrants (Figure 4). In general, wells with oil rates lower than average fall into the lower 2 quadrants. Here, the wells belonging to the blue quadrant have the highest problem score and the wells from the green quadrant have the moderate problem score. Same applies for gas wells in that case gas rate change is estimated.
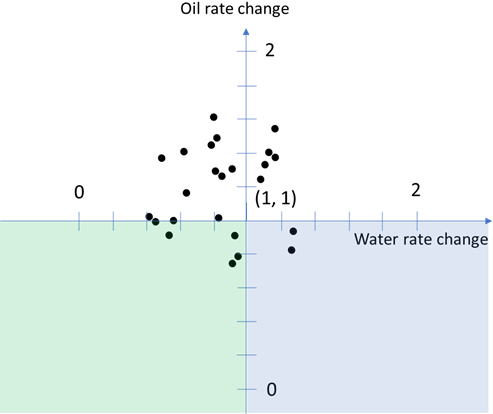
Figure 4. ABC plot example
Heterogeneity Index Calculation
In Heterogeneity Index (HI) Analysis different performance indicators are compared to surrounding wells (average performance of a group of offset wells reservoir grouped) to find under or over performing wells. The following formula is used to calculate HI for each phase:

where:
- HIFluid(t): is the Heterogeneity Index [-] calculated for oil, gas, water, or the total fluid produced, over a specific period of time (t).
- n(t): is the number of active neighboring wells in a specific period of time (t) to which the well in question is compared.
The heterogeneity Index normalizes the effects of the well's production lifetime and reservoir pressure. This allows assessing completion efficiency and reservoir quality of many producing wells. The following figure shows one possible utilization of HI calculation.
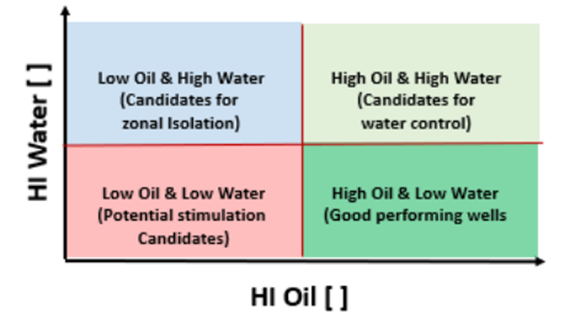
Figure 5 HI Status Indicator
The diagram can be divided into four quadrants. The best performing wells would lie in the lower right quadrant with a HI for oil that is larger than zero and a HI for water that is smaller than zero, indicating a higher-than-average oil production and a lower-than-average water production. On the other hand, the worst performing wells lie in the upper left quadrant with lower-than-average oil production and higher-than-average water production. A well with such conditions needs further investigations and to be recommended as a water shut-off candidate.
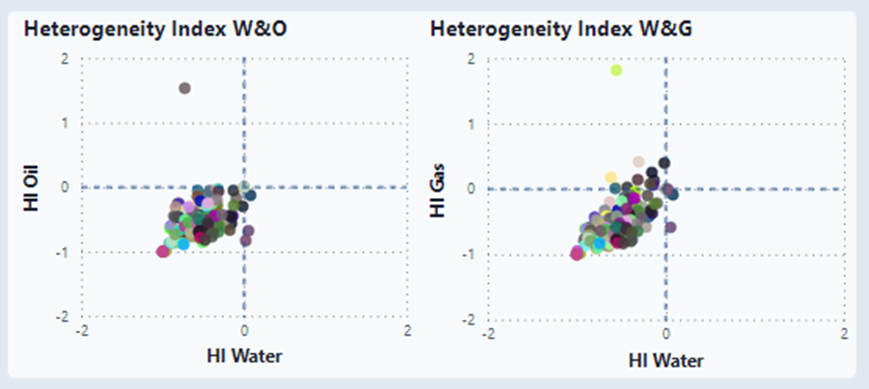
Additionally, well completion and reservoir performance can be classified according to the features in a plot of heterogeneity index of oil versus time. For example, a well at the beginning of production has a very low HI (HI oil<0), however, later HI values become larger than zero can be classified as a well with a bad completion but a good performance due to reservoir properties. HI calculations can also contribute to completion efficiency analysis where the well performance is compared to petrophysical properties that have been measured at a well’s location. The analysis can be performed simply by plotting hydrocarbon pore thickness versus the heterogeneity index of oil (e.g.: high HCPT but low HI oil would indicate that the well produces worse than its geological potential would allow). Such analysis gives a prompt and proper overview of which wells need investigations and actions have to be taken in the future.
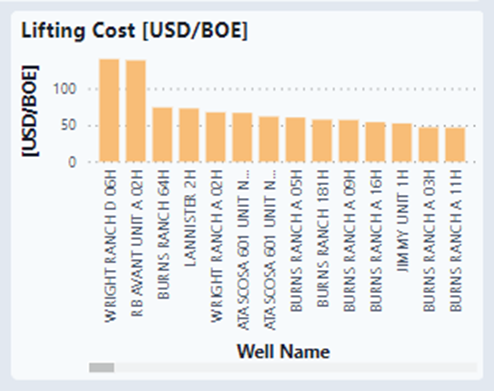
Lifting Cost
Lifting Cost is defined as:

Calculated on a monthly basis.
