Identification of GL underperforming wells is a crucial step because early detection of such wells may improve their economics.
The current workflow screens all the gas lifted wells based on their Target Injection Differential and Well Performance Factor. Wells with low Performance Score are the first candidates to look for inefficiencies. It is calculated as follows:
Well Performance Score = 1 – ((1 - w1∙Target Injection Differential) + w2∙Well Performance Factor),
where w1, w2 – weights that determine the importance of each component.
Currently
w1 = 10%
w2 = 90%
Target Injection Differential indicates how much the casing head pressure and the well head pressure are different. It is calculated as follows:
Target Injection Differential =
(Casing Head Pressure – Well Head Pressure) / Casing Head Pressure
Well Performance Factor is indicative of the GL performance. Higher values indicate inefficiency. It is estimated as follows:
Well Performance Factor = Gas Lift gas Injected / (Produced Oil + Produced Water)
Visualization
A dashboard for the engineering team gives an overview of the wells which can be screened.
Home Tab
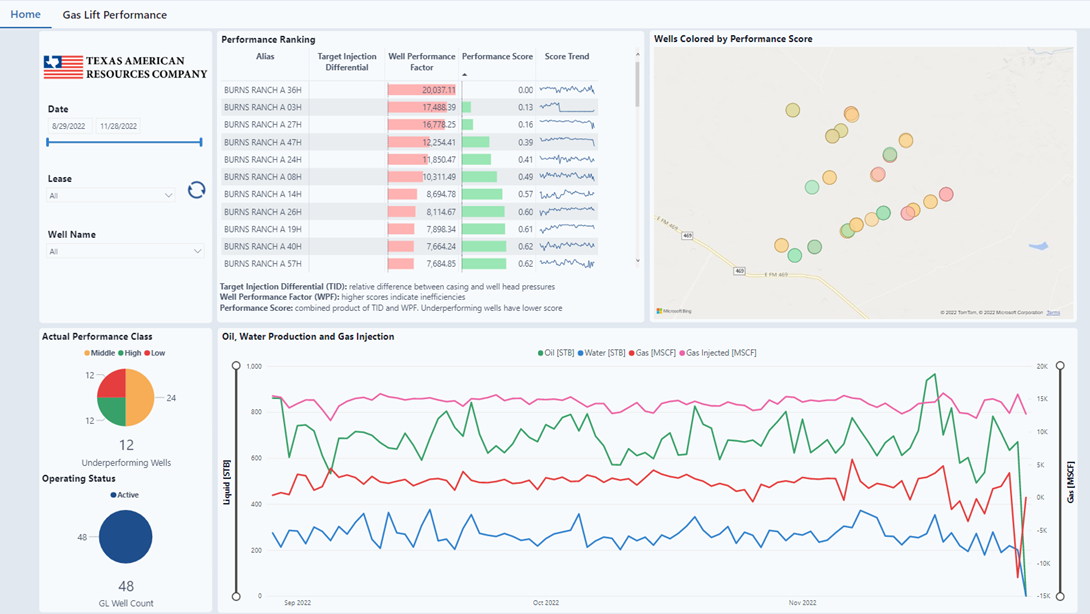
Performance Ranking
Engineers can quickly view low Performance Scores to look for inefficiencies. Notice that casing and tubing pressures were not available for the gas lifted wells.
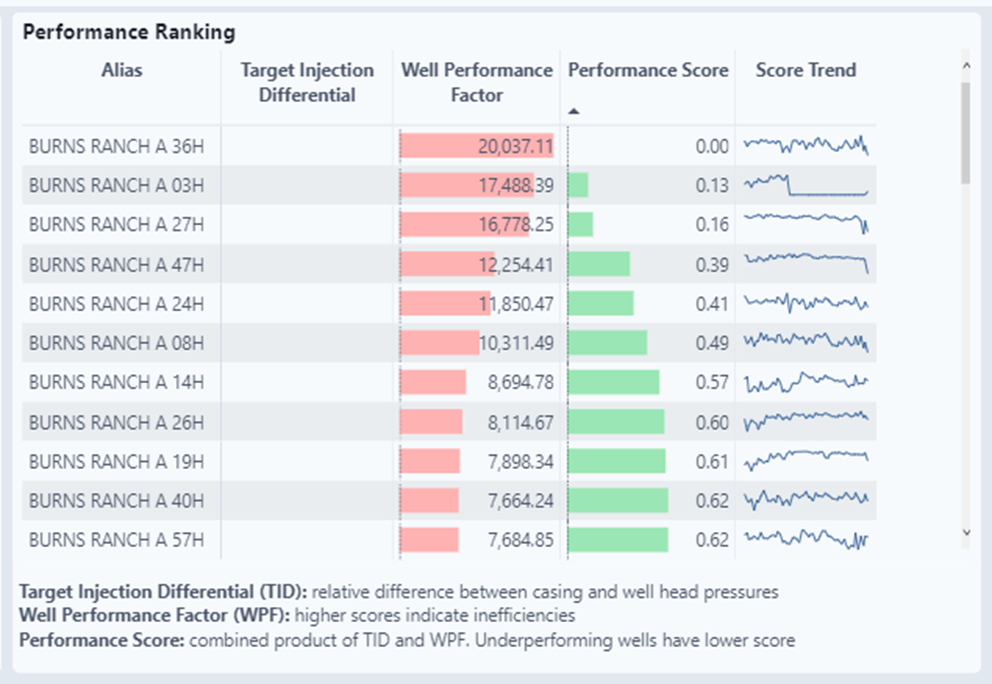
Actual Performance Class and Operating Status
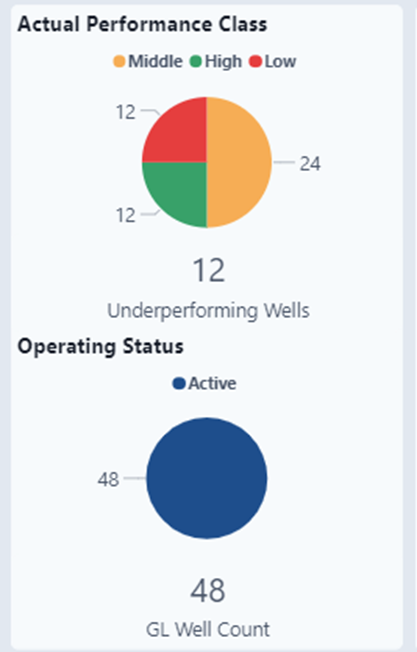
Class is a percentage. 25% of all wells are considered Low Performance, 25% are considered High Performance, and 50% are Middle Performance.
Status just shows the number of Active Gas Lift Wells on this dashboard.
Wells Colored by Performance
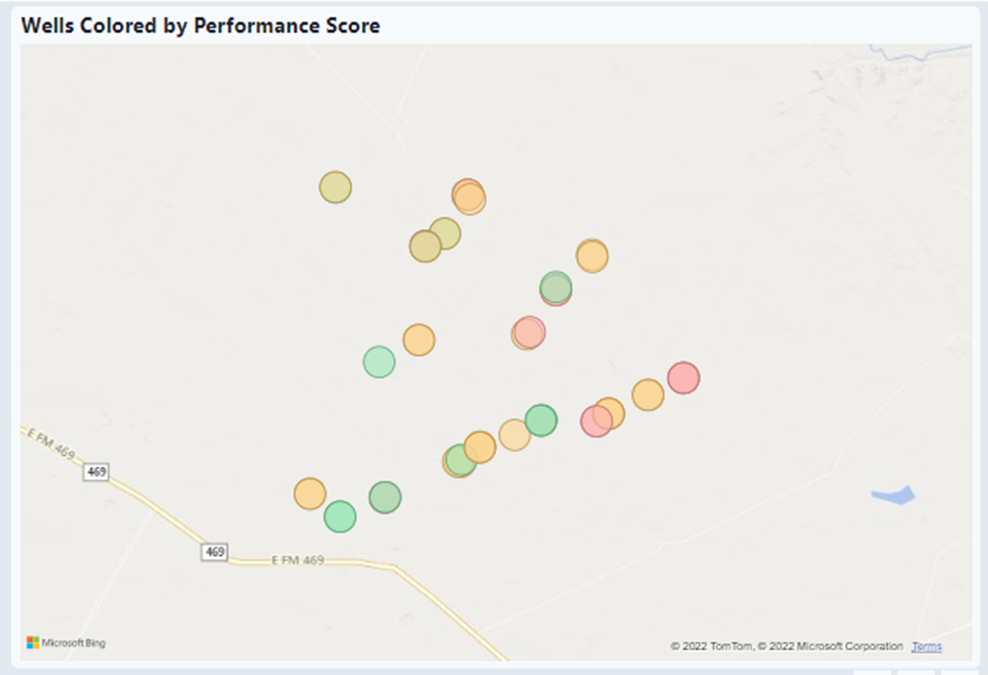
Map shows all Gas Lift wells in the dashboard. Color aligns with performance. Green are better producers than red wells.
Oil, Water Production and Gas Injection
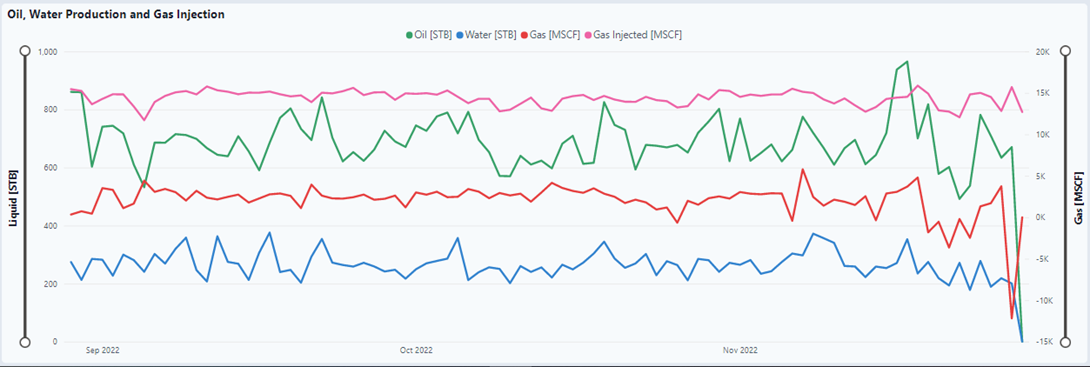
Shows the trend lines over time for Oil, Water, Gas, and Gas Injection. If only a single well is selected, it will sort to show the trend lines for the selected.
Gas Lift Performance Tab
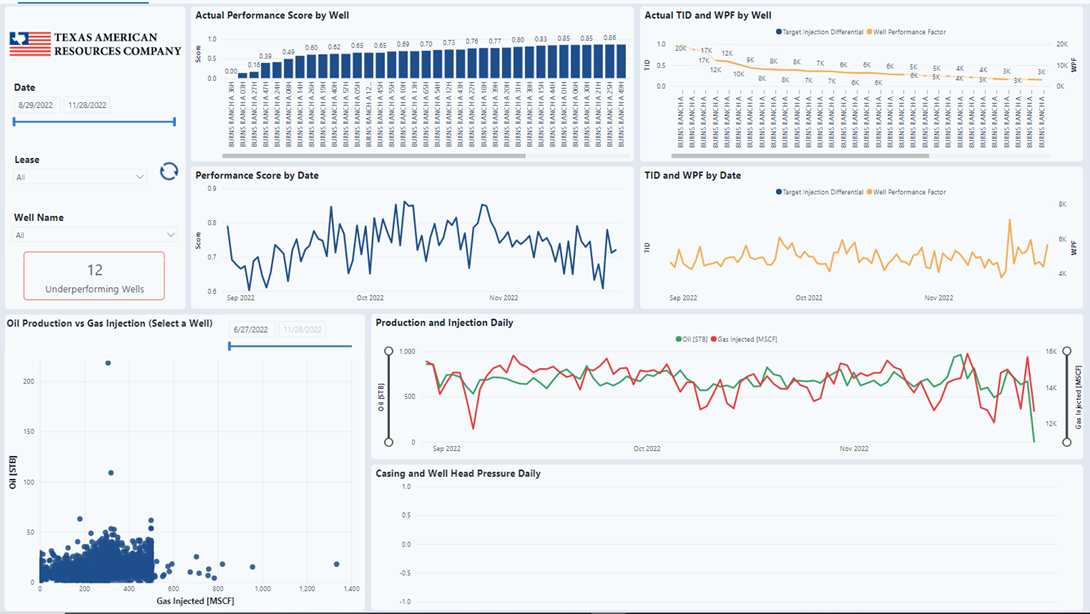
Actual Performance Score by Well
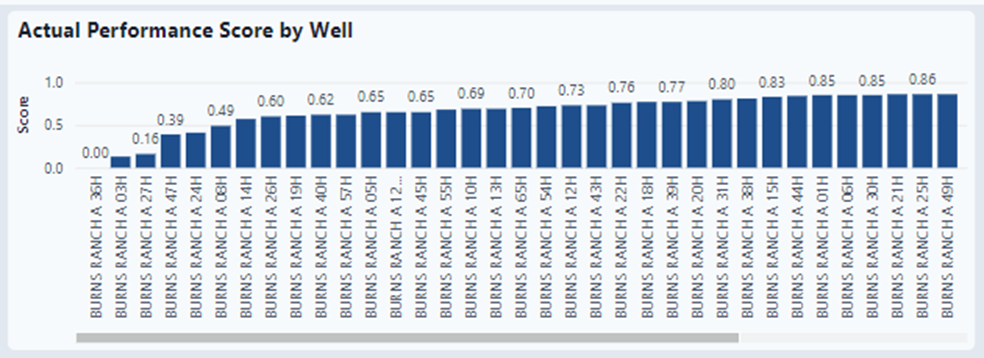
Bar graph showing the ranking of wells. Lower score should be reviewed by an engineer for inefficiencies.
Actual TID and WPF by Well
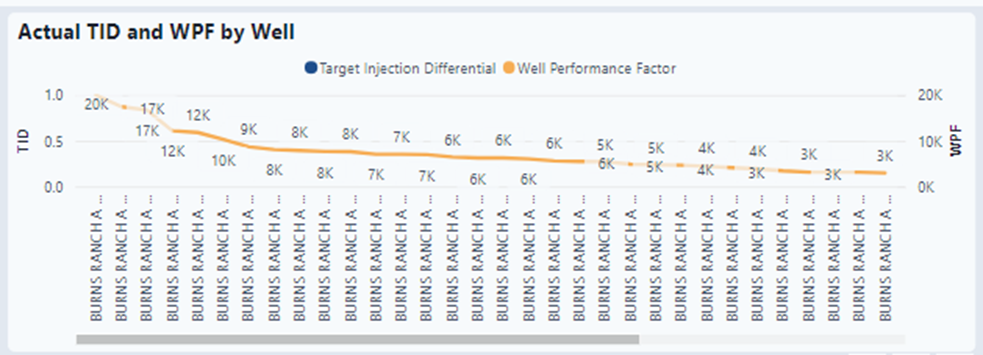
Line graph showing the Well Performance Factor by well. Target Injection Differential would also be seen if casing and tubing pressure were available.
Performance Score by Date
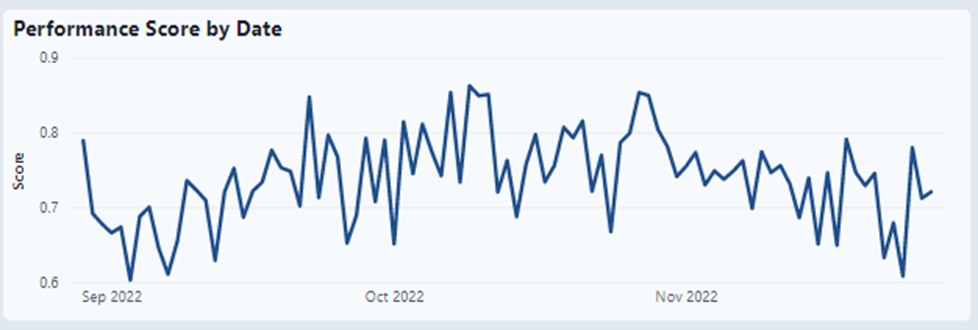
This is an aggregate of all scores. Select a well to see the trend over time.
TID and WPF by Date

This is an aggregate of all scores. Select a well to see the trend over time.
Oil Production vs Gas Injection (Select a Well)
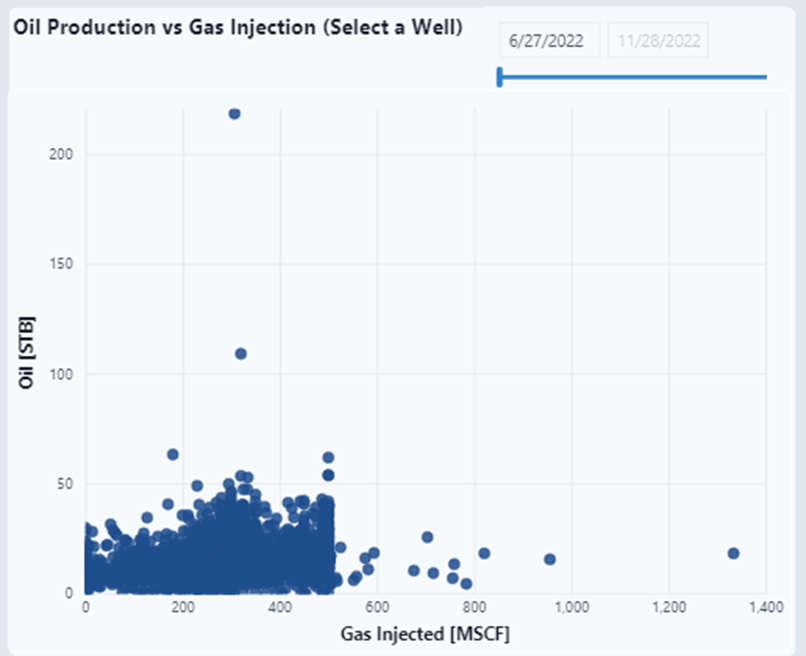
To use this graph, select a single well. Notice that the time slicer at the top right is also applicable to this graph. This graph shows the relationship between gas injected and oil produced (both volumes) during a defined period for a given well.
Production and Injection Daily

Line graph showing Produced Oil (green line) & Injected Gas (red line).
Casing and Well Head Pressure Daily

Shows pressures over time. Not available until pressures are available.
