- Weatherford Knowledge Base
- Customer Training
- Training Objectives by User
-
Getting Started
-
Customer Training
-
Customer Success
-
Updates
-
Production Optimization
-
Artificial Lift Optimization
-
Completion Optimization
-
Environmental, Social & Governance
-
Development, Acquisition & Divestitures
-
Enhanced Oil Recovery
-
Admin
-
P#
- Getting Started with P#
- Data Cleansing
- String Functions
- Scenario Functions
- Regression Functions
- Placeholder Functions
- Mathematical Functions
- Logic Functions
- Entities Function
- Moving Window Functions
- Time and Date Functions
- Statistical Functions
- Economic Functions
- Data Handling
- Additional Functions
- Directional Functions
- Machine Learning Functions
- DCA Functions
- Neighborhood Functions
-
Packages
Sabine Business Unit Production and Budget Charts
Learn how to connect, analyze, and review your data in PetroVisor™.
Develop
- How to load the Business Unit Production vs Budget Charts and Tables in PetroVisor™?
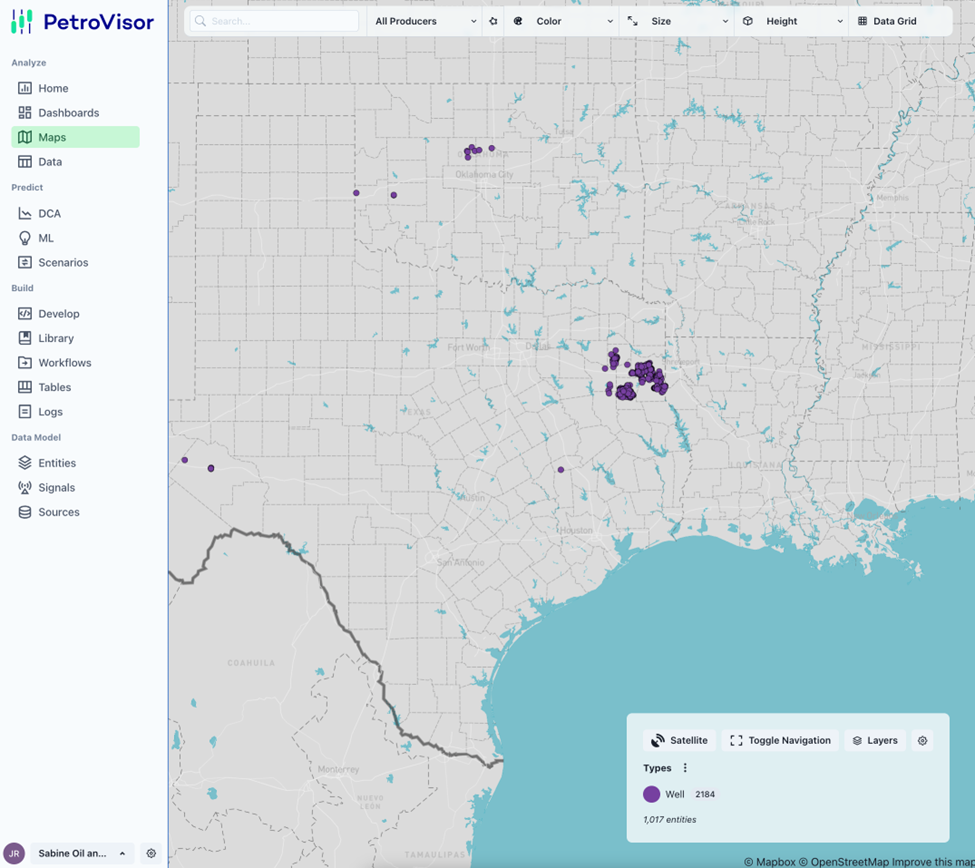
From the PetroVisor™ landing interface, click on Data under Analyze.

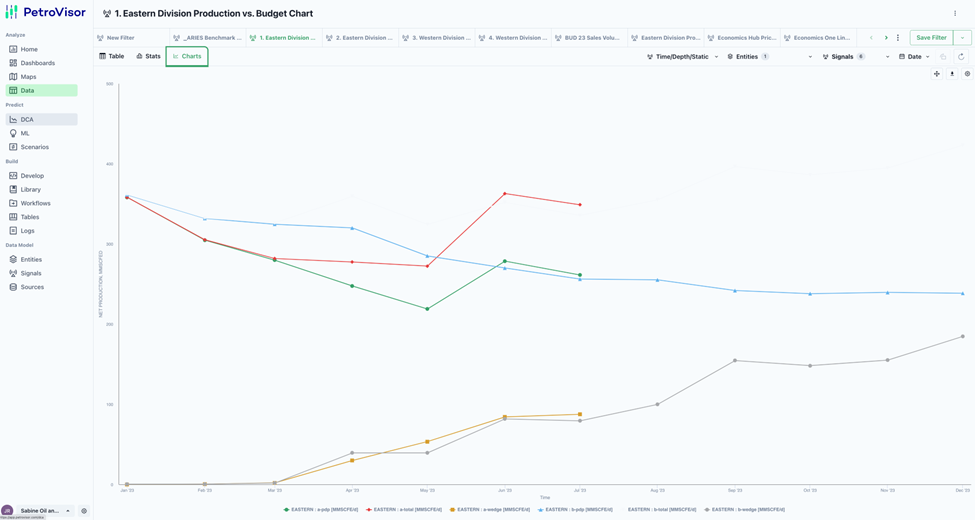
There are four pre-defined data views to analyze Production vs. Budget by Division:
- Eastern Division Production vs. Budget Chart
- Eastern Division Production vs. Budget Table
- Western Division Production vs. Budget Chart
- Western Division Production vs. Budget Table
Charts
To visualize the pre-defined charting templates, simply click on the desired Division and click on Charts.

Tables
To visualize the pre-defined tables, simply click on the desired Division and click on Table.

