Analyze
Dashboards
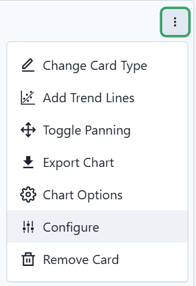
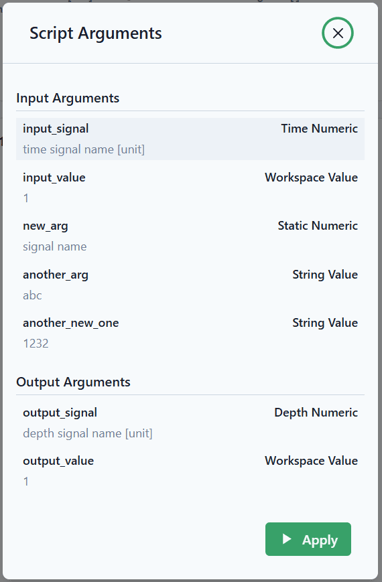
- Users can now configure input arguments for Python dashboard cards, overriding default script values. This feature facilitates the reuse of generalized plots with varying inputs. By clicking the option icon and selecting "Configure," users can easily update pre-filled argument values.
Data
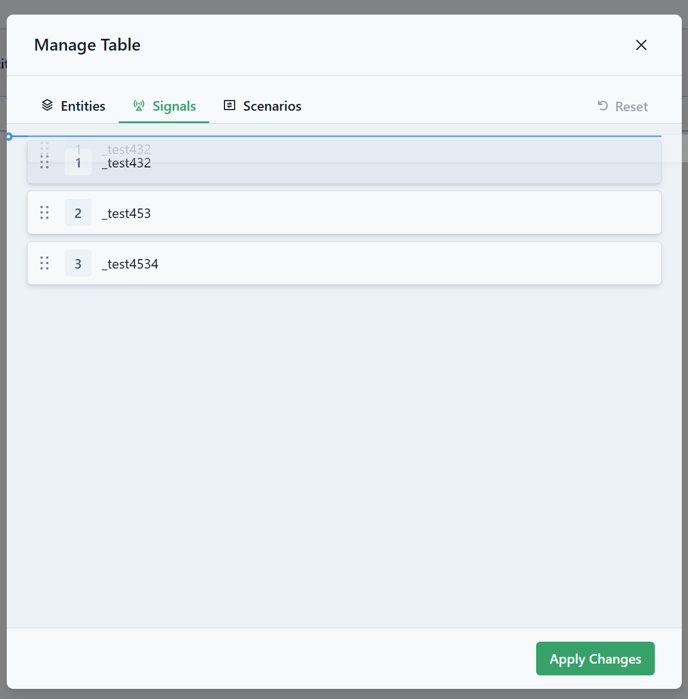
- Users can now reorder columns in the data views by clicking the "Manage Table" button and navigating to the "Signals" tab, allowing for enhanced customization of data presentations.
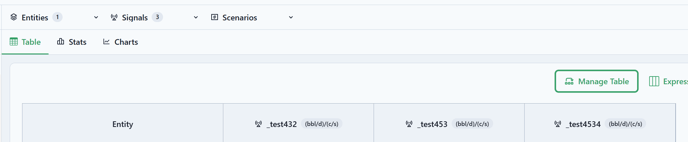
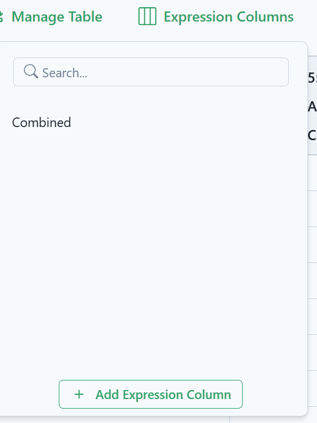
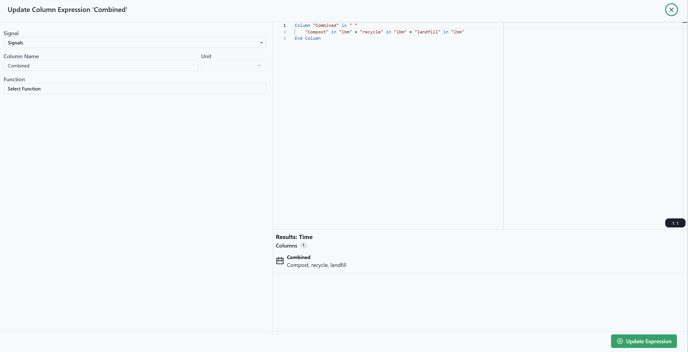
- Users can now easily update expression columns by clicking the "Expression Columns" button. This action will display a list of available expressions for modification. Simply select the desired expression, and a new expression editor window will appear, allowing for seamless updates.
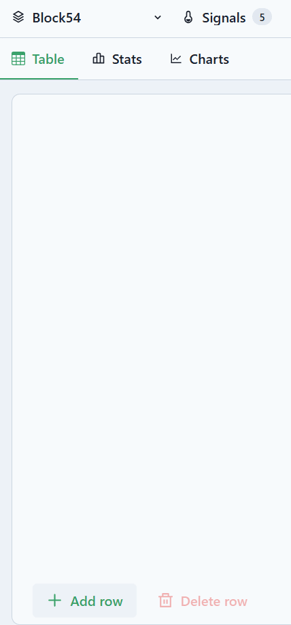
- Users can now add PVT data to a data view regardless of existing data. After selecting an entity and signal, the "Add Row" and "Delete Row" options will be available, enabling flexibility in creating PVT data even when no data is present.
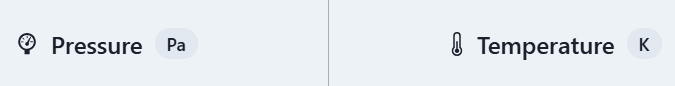
- The icons for Pressure and Temperature on PVT data views have been updated to enhance clarity and distinguish them from other signal icons.
Build
Develop
- Python: Script validation now utilizes the Language Server Protocol (LSP) endpoint for enhanced accuracy and efficiency.
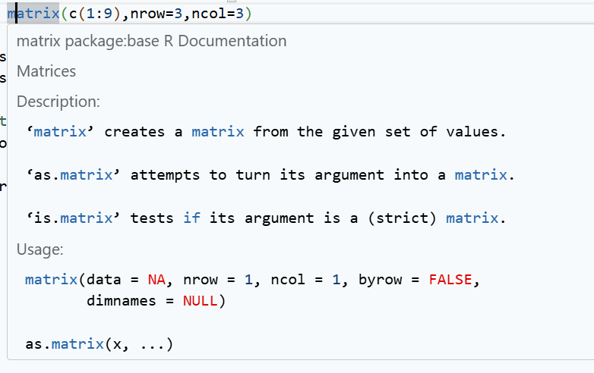
- Enhanced R script validation now includes syntax checks and warning notifications, alongside newly added support for the R language server.
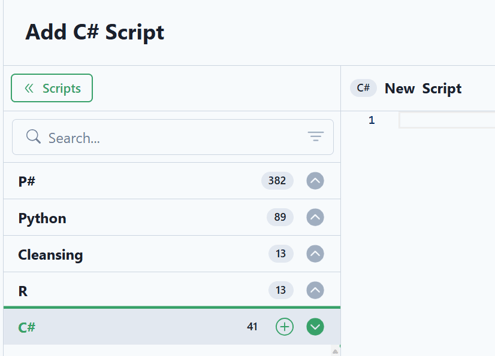
- Users can now view C# scripts within the Develop environment. Additionally, C# activities can be created directly from the web application, and the code editor offers the same robust features available for other supported programming languages.
Workflows
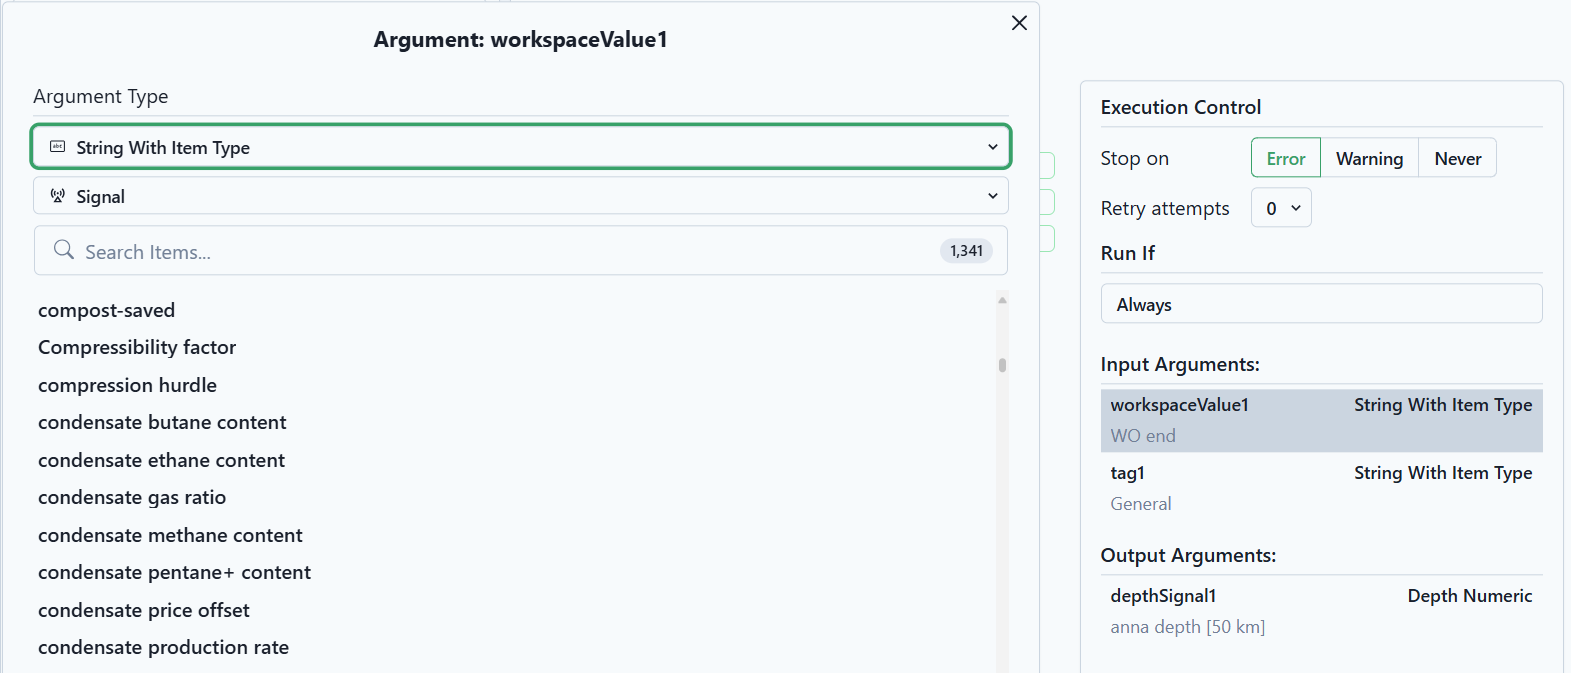
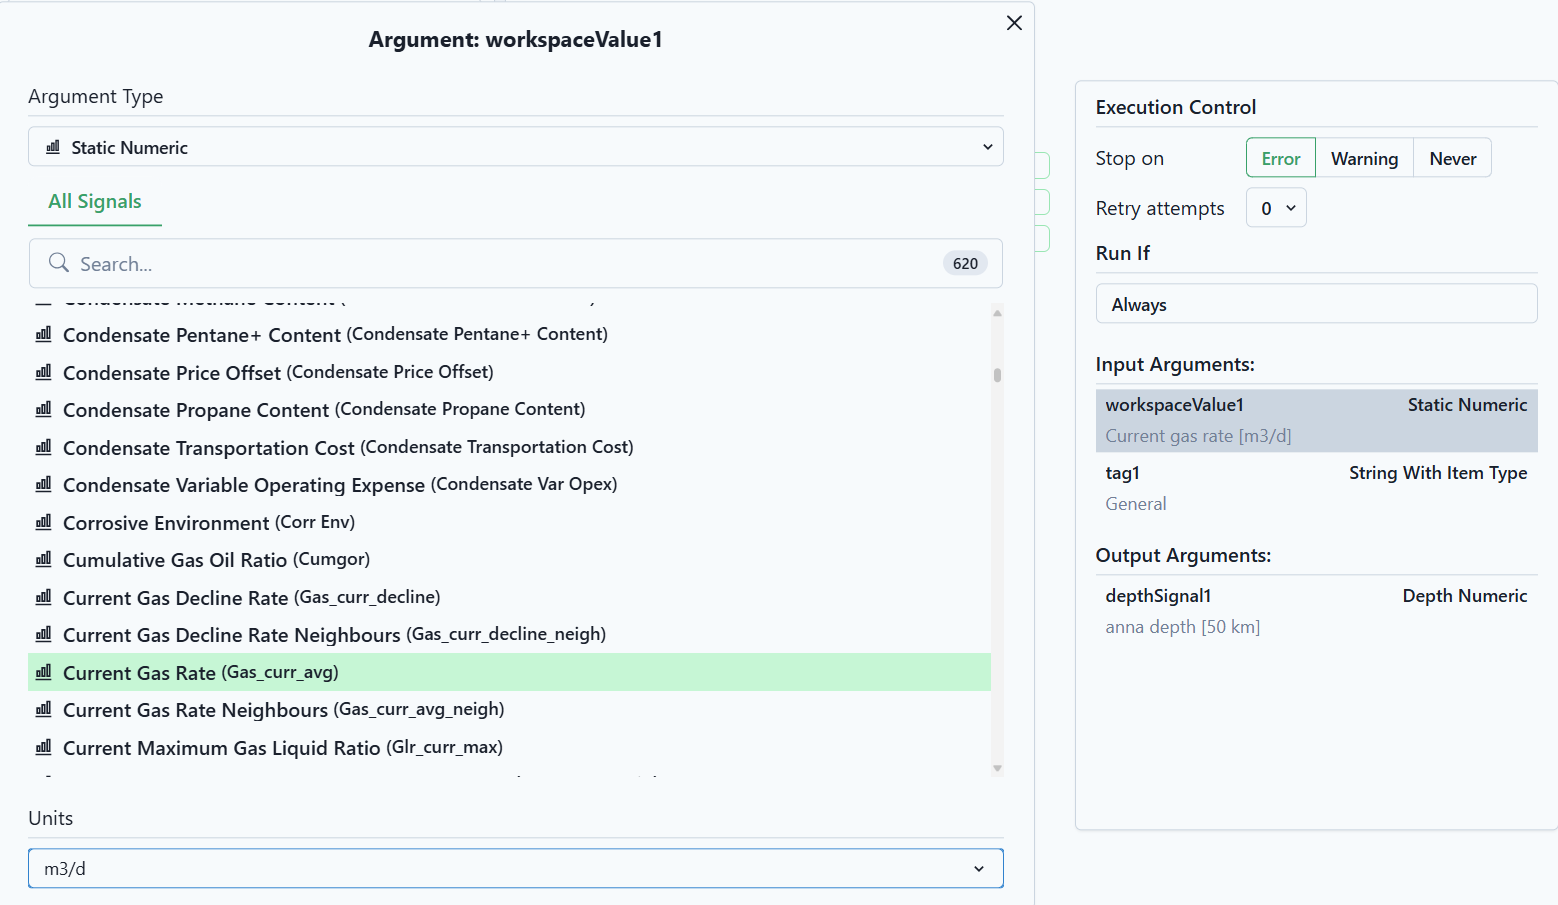
- Within a workflow activity, users can now utilize a new argument type called StringWithItemType. Additionally, there is support for updating the unit measurement for argument types that involve Signals.
Tables
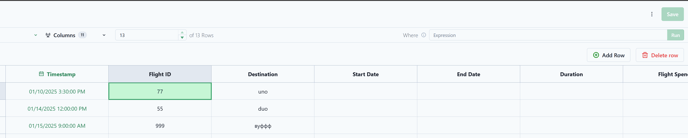
- Users now have the ability to add new rows to reference tables, as well as update or delete existing data within the rows.
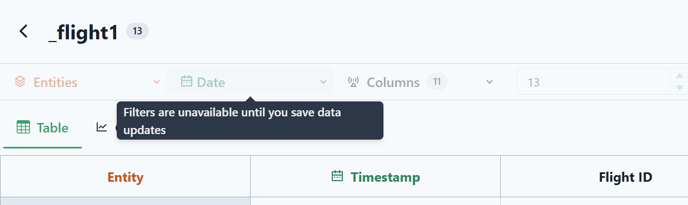
- Filters in reference table headers are temporarily disabled during changes to prevent data loss, with a tooltip notification indicating their unavailability until updates are confirmed.
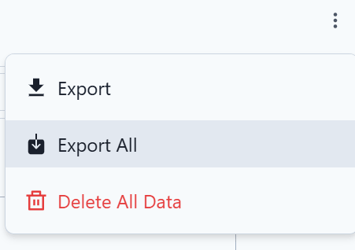
- Users can now export the complete reference table, allowing for the retrieval of all data, not just the rows currently loaded and displayed, by selecting the "Export All" option.
Logs
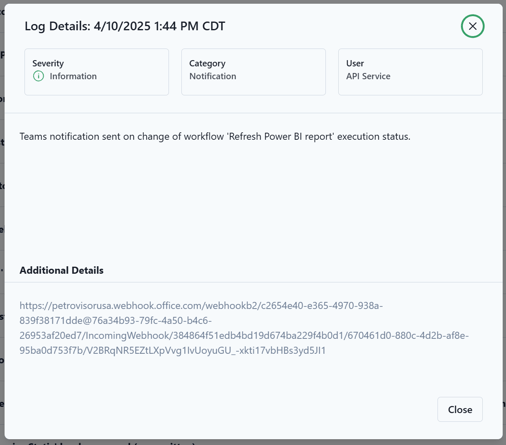
- Log entries are now interactive; clicking on them will reveal detailed information about each log entry.

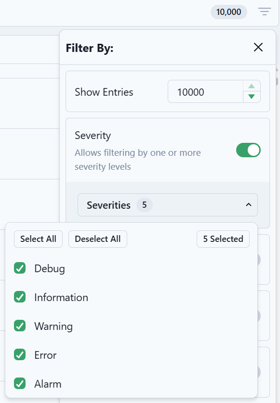
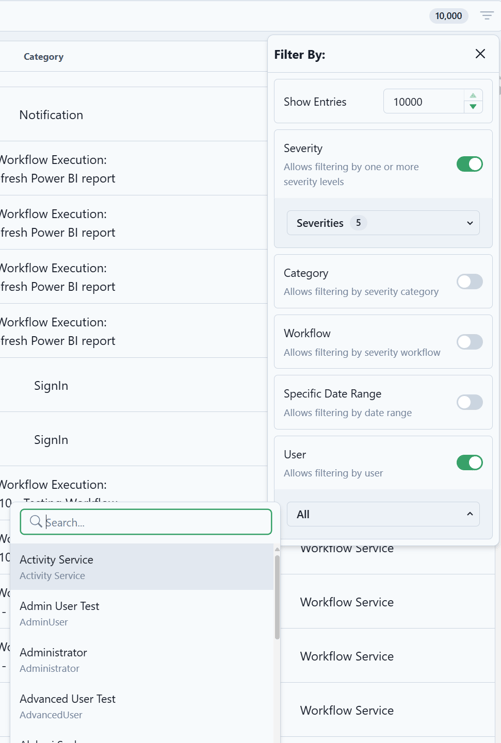
- Users can now filter log entries by severity and select to filter by multiple severity types. Additionally, filtering by User is also available, enhancing the ability to manage and analyze logs effectively.
Data Model
Sources
- In the Data Connections, Data Sources, and Data Integrations sections, the main button in the upper right corner now displays "Save" instead of "Add Connection" to improve user-friendliness and streamline the process.

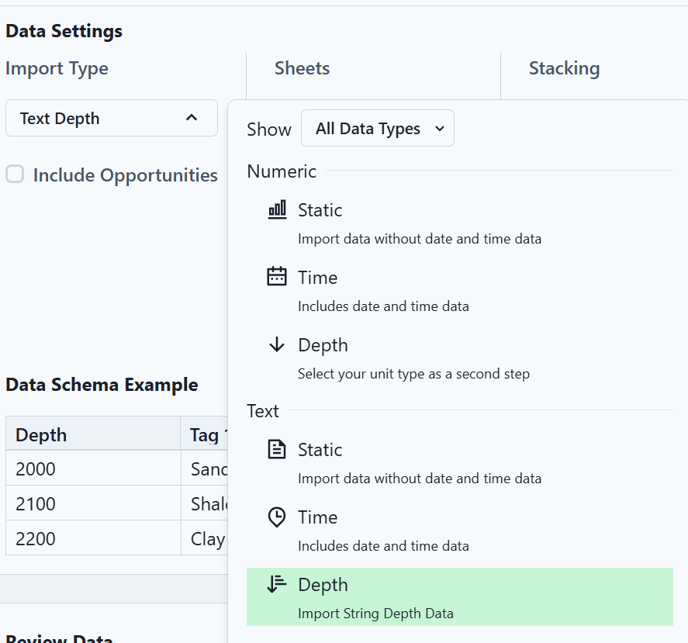
- Introduced the capability to import and map text-based depth data via source integrations.
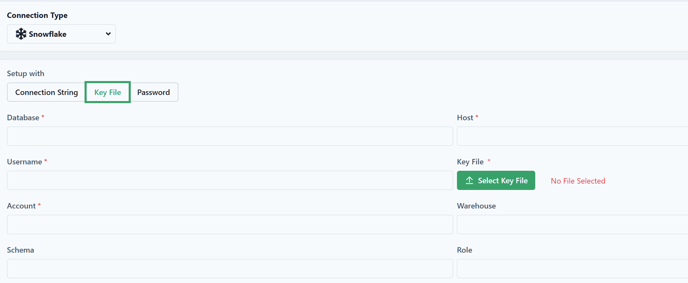
- New options for Snowflake connections allow users to define the Connection String as free text, removing the need for a separate username and password, similar to Oracle. Users can also authenticate using a Key File by uploading the specified file.

- A new update in PetroVisor adds data integration options: Overwrite, Skip, Delete, and Delete All. By default, data is deleted only when new data is available to avoid unintended loss. Users can now overwrite existing data, skip integration if the source is empty, or delete existing data before adding new information, enhancing flexibility in data handling.

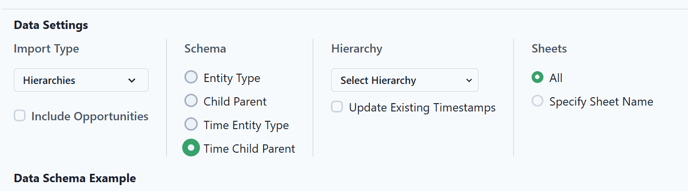
- Introduced the ability to import both time-dependent and static child-parent hierarchies through Data Sources.