Track LOE expense on a monthly basis to determine oil and gas sales.
There are nine (9) tabs associated with the LOE-LOS Dashboard:
- Accounting
- Activity
- LOE Tracking
- Field LOE Tracking Accounting
- Field LOE Tracking Activity
- Well Profitability Accounting
- Well Profitability Activity
- Well Profitability (Fixed Price)
- Well Profitability (Fixed Price) Activity
These tabs have the same information for both Accounting and Activity. For instance, the same charts are displayed for both Well Profitability Accounting and Activity.
Tools
The same tool is used on each dashboard to refine the data viewed.
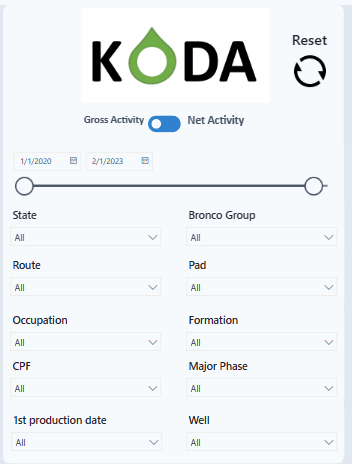
The top section sorts the data by:
- Gross Activity vs Net Activity
- Date
- State
- Bronco Group
- Route
- Pad
- Occupation
- Formation
- CPF
- Major Phase
- 1st production date
- Well
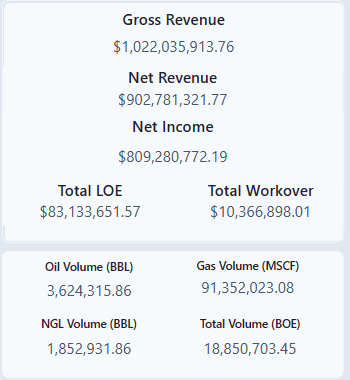
After sorting the bottom filter displays
- Gross Revenue
- Net Revenue
- Net Income
- Total LOE
- Total Workover
- Oil Volume (BBL)
- Gas Volume (MSCF)
- NGL Volume (BBL)
- Total Volume (BOE)
Accounting / Activity
The Gross and Net Accounting numbers are coming from specific scripts. The net and gross amounts include different accounting categories and therefore change when either Gross or Net is selected. These scripts can be found under the Develop Section on the Navigation Panel.

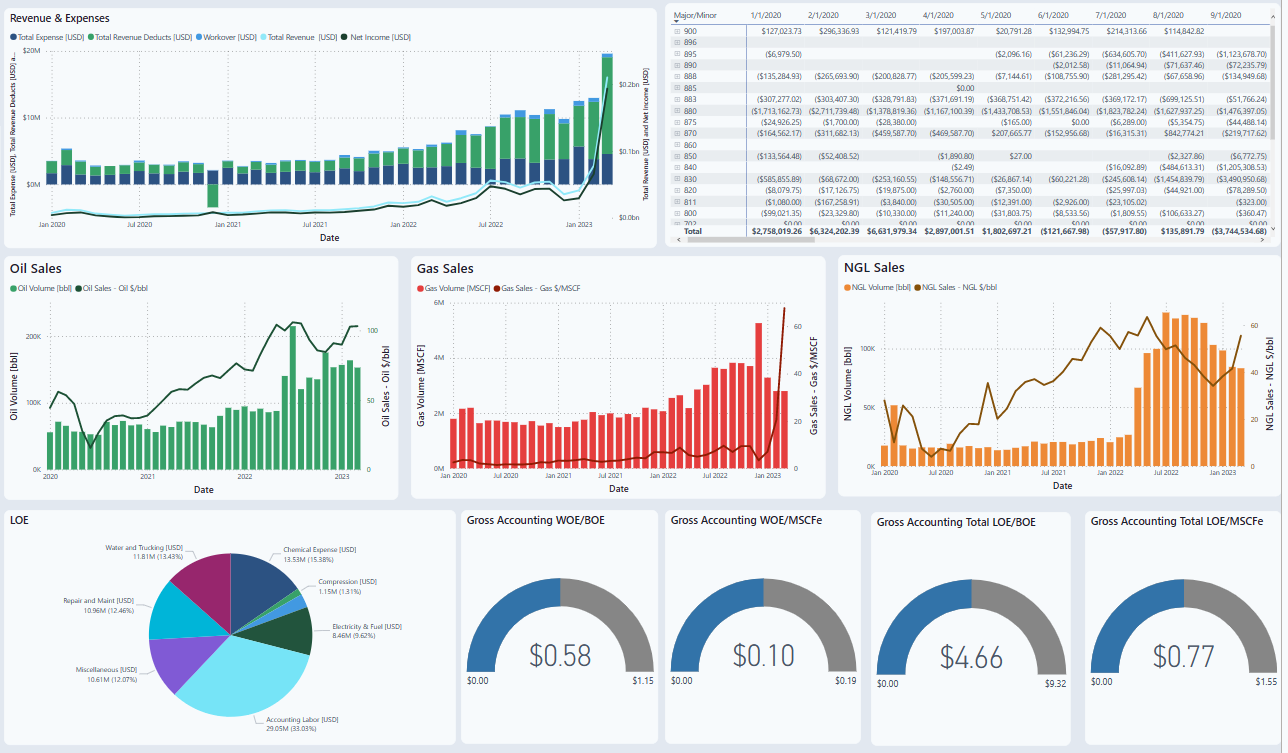
The screen displays revenue and sales in multiple different charts.
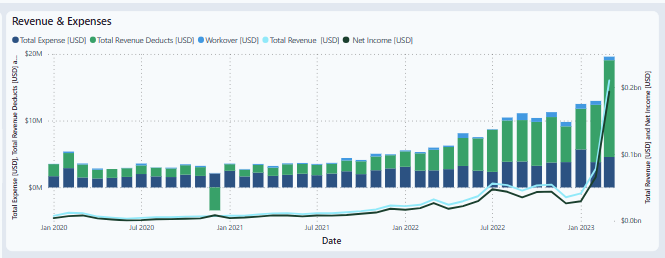
Revenue & Expense
This graph displays Total Expense, Total Revenue Deducts, Workover, Total Revenue, and Net Income.
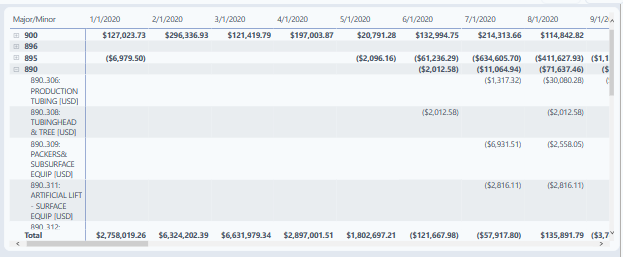
Major / Minor Accounting
This tables displays all major and minor accounting by month. To drill down into the data, select the plus sign next to the major accounting line.
Oil Sales / Gas Sales / NGL Sales
These charts display the sales of the specific hydrocarbon over time. The occurrence volume date is the oil is recorded out of the field. The sales date is the day the sales happened.

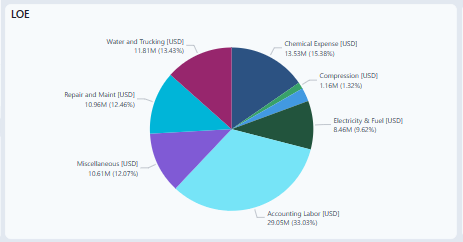
LOE
This pie chart breaks down the LOE by category.
Gross Accounting or Gross Activity vs KPI
This graph shows accounting vs. WOE/BOE, WOE/MSCFe, Total LOE/BOE, & Total LOE/MSCFe. If no workovers occurred in the selection, the chart would show $0.00.

View other data such as Production Taxes
A simple way to view specific data, like production taxes is to use the filter on the side of the Power BI.
In Data, select different signals to view. In the example below, the signal, Gross Accounting Production Taxes is selected.

LOE Tracking
This tab is for field personnel looking at Activity only.
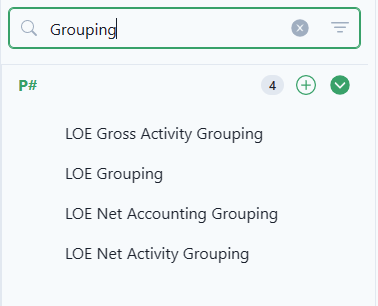
The grouping of the LOE category is based on the major and minor accounts and can be found in the P# script LOE Gross Activity Grouping. It adds up the major and minor accounts as KODA would like to see them. Net numbers are from the script LOE Net Activity Grouping.
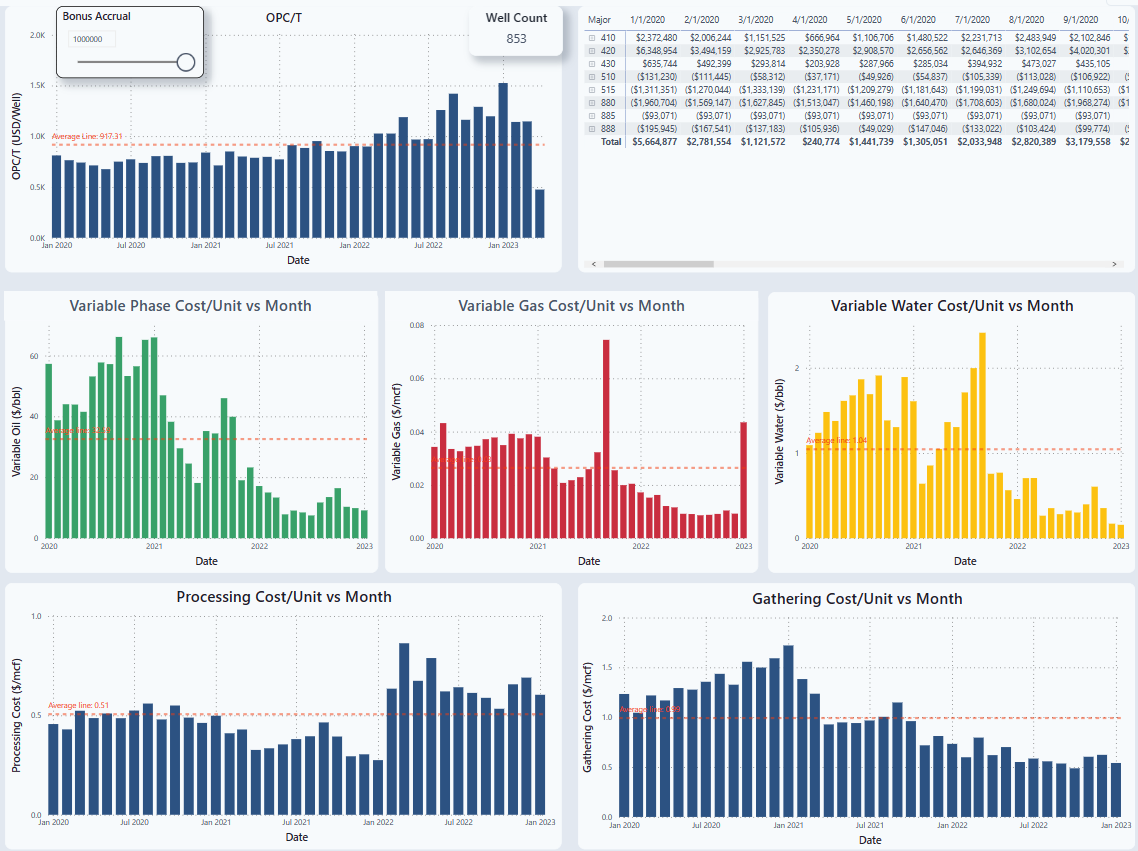
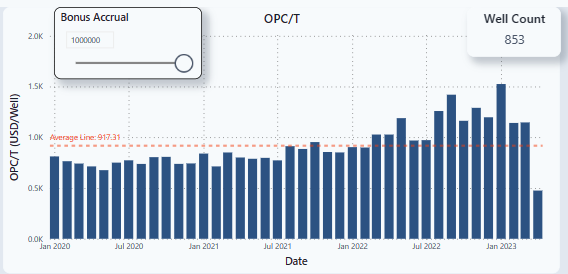
OPC/T
Operating Costs over total wells.
OPC/T = (OPC/T + Bonus Accrual)/ (Well Count). The graph is dynamic and will update with changes to the Bonus Accrual.
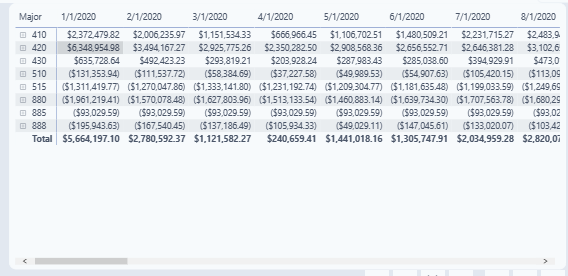
Chart
Displays only the major accounts for field personnel.
Variable Costs/Unit vs Month
Displays costs / month for Oil, Gas, & Water. These have a dynamic title for variable oil and gas depending on Bronco group phase.

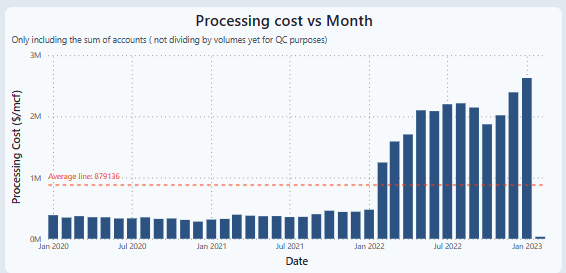
Processing cost vs Month
By month processing costs.
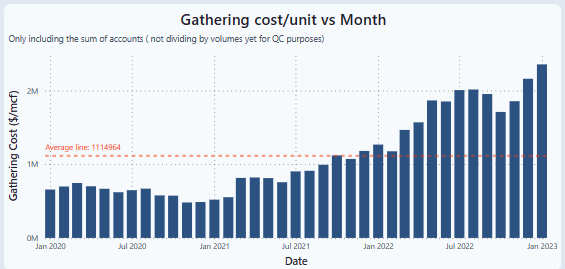
Gathering cost/unit vs Month
By month gathering costs.
Field LOE Tracking Accounting / Activity
This tab displays the LOE for the field.
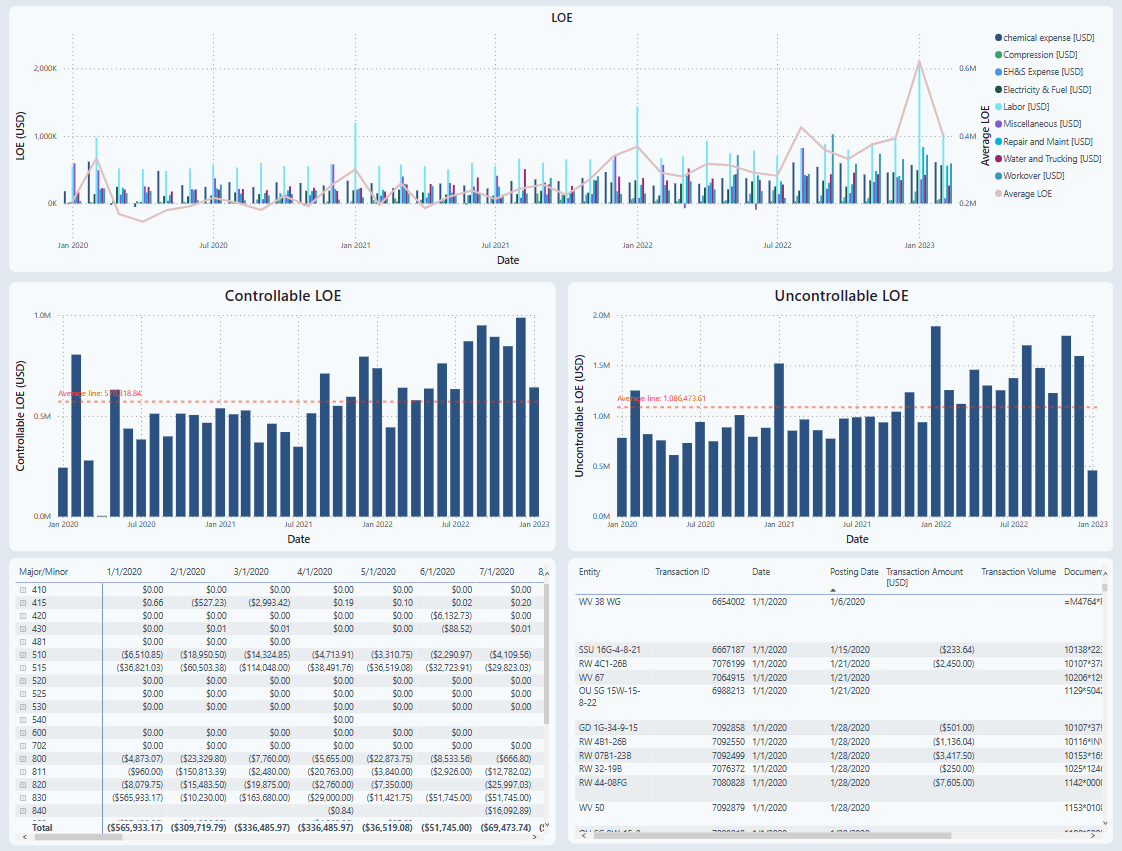
LOE
Displays LOE with a line showing the average.

Controllable LOE / Uncontrollable LOE
Graphs are broken out to display Controllable and Uncontrollable LOE. This data is coming from the LOE Gross (or Net) Activity Grouping.

Charts
Displays major and minor Accounting and a transaction table. When a major account is selected, it will show the associated transactions.

Well Profitability Accounting / Activity
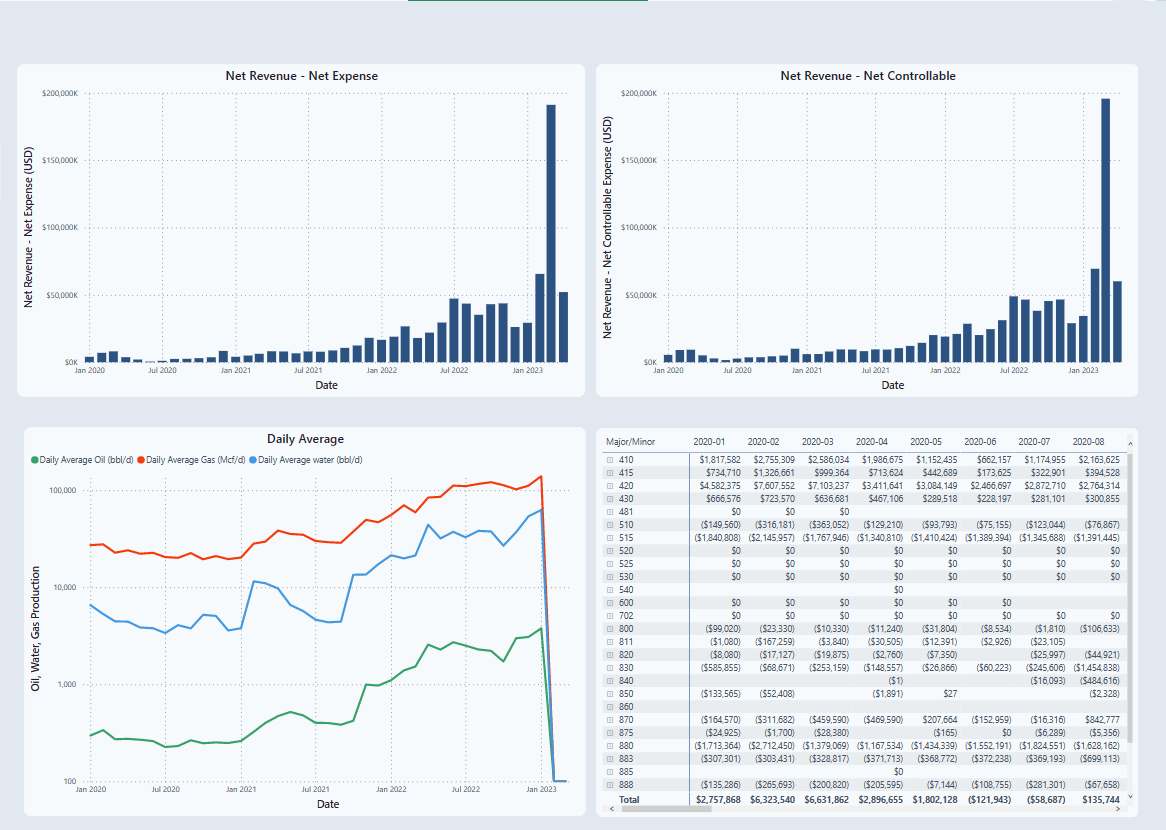
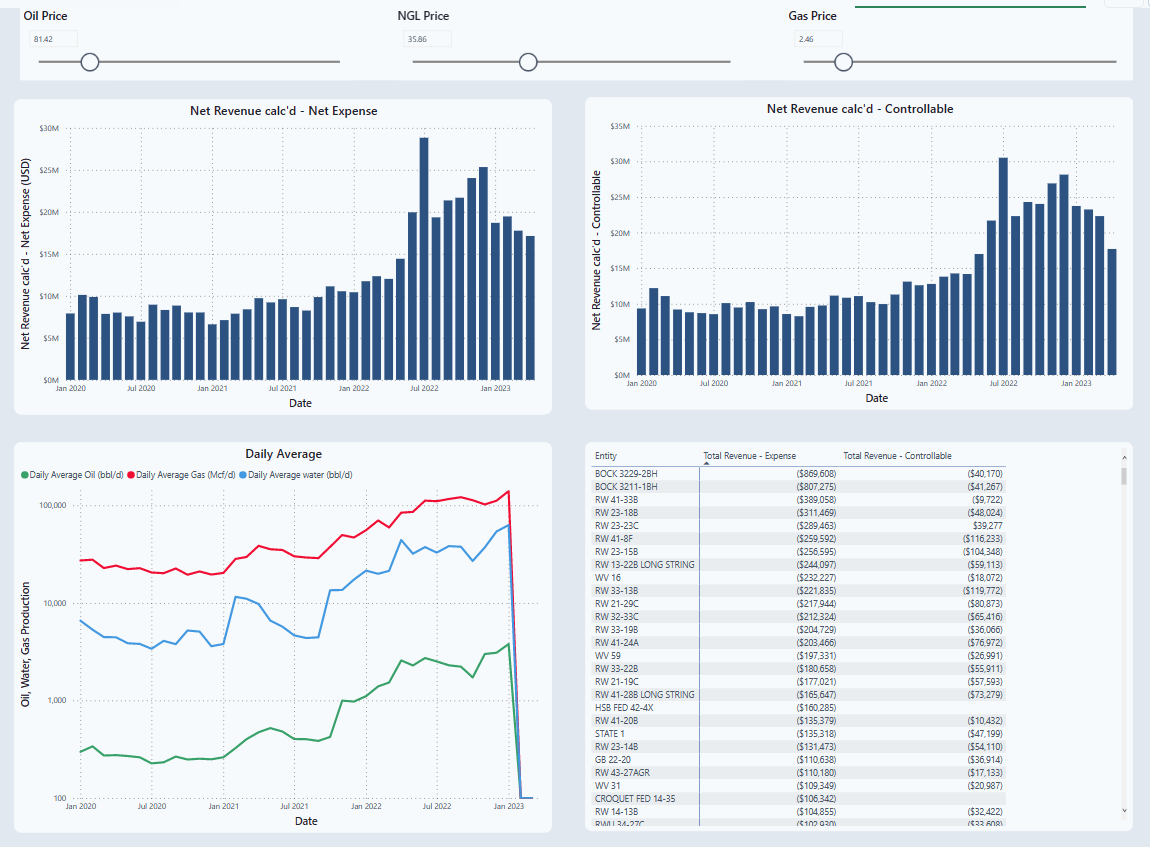
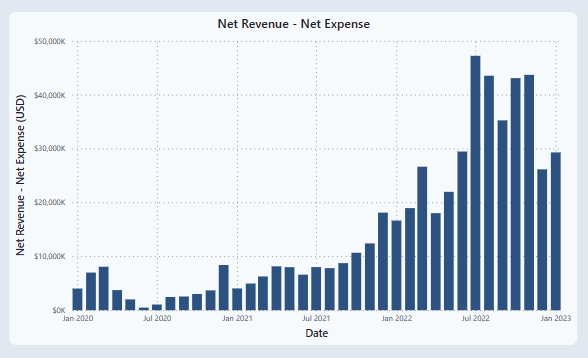
Net Revenue - (minus) Net Expense
Graph is total revenue minus expense. Expense includes Controllable, Uncontrollable and workover costs.
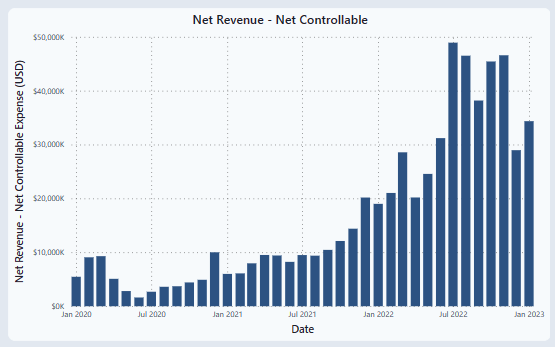
Net Revenue - (minus) Net Controllable
Graph is total revenue minus controllable.
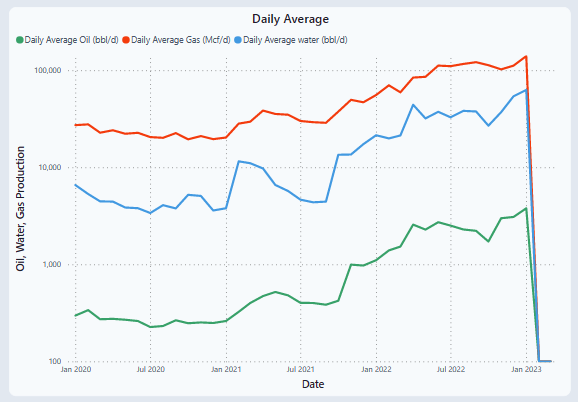
Sum of Gas Volume MCF, Sum of Oil Production, Sum of Water Production by Date
Daily Average Oil, Gas, water on a (y) logarithmic scale.
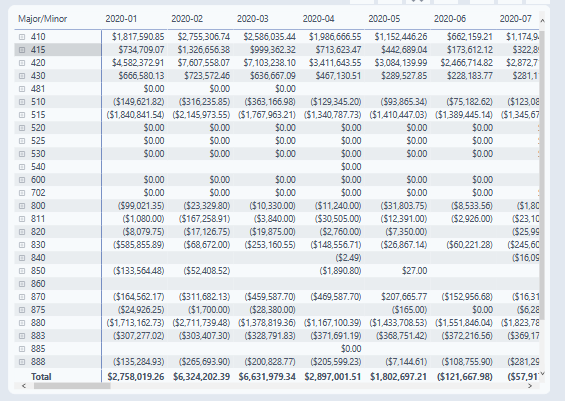
Chart
Chart of major and minor accounts.
Well Profitability (Fixed Price) Accounting / Activity
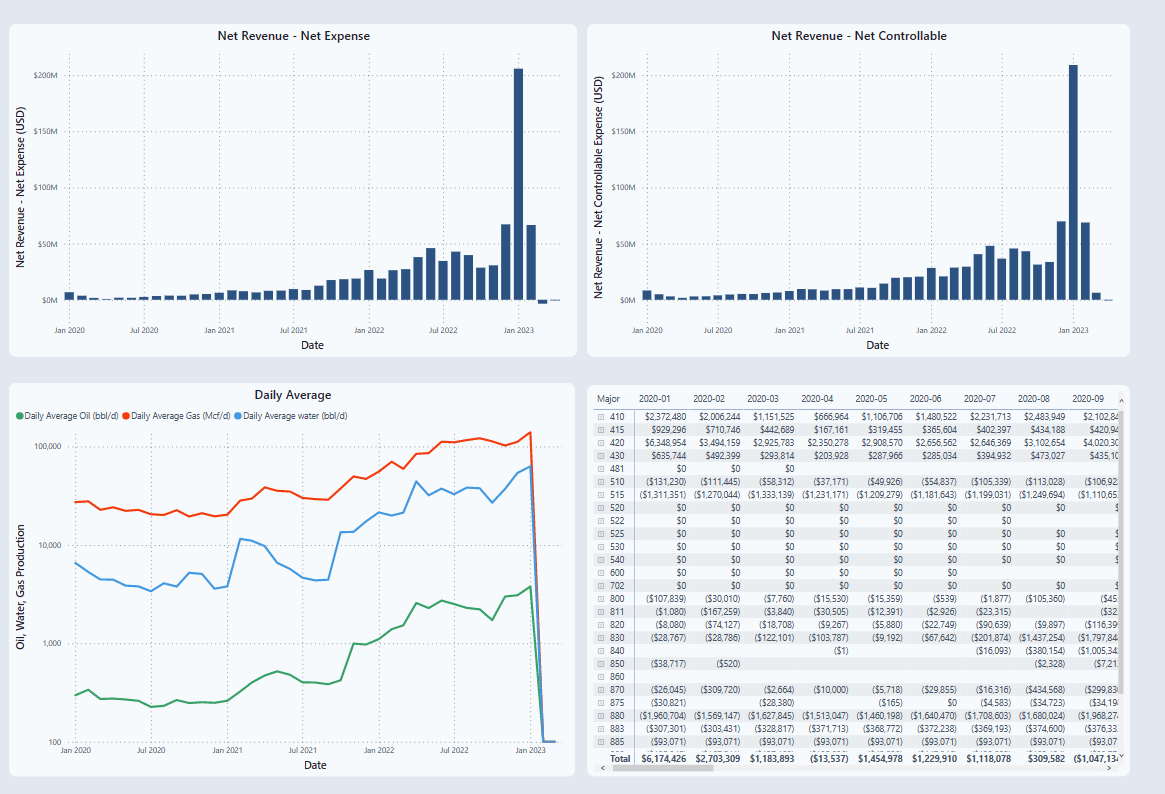
This tab was developed to see how different oil, gas, and NGL price effects revenue.
Oil Price / NGL Price / Gas Price
Based on the selected price, the charts will automatically update.

Charts will display the same information from the Well Profitability section based on the selected the price. This feature allows the user to determine how prices will affect revenue.
