Completion Optimization in PetroVisor is driven by Economics (maximizing NPV or IRR)
Why do you need Completion Optimization?
Oil and Gas Operators are continuously improving the way they complete horizontal oil and gas wells. Economics is the key driver for optimization (maximizing NPV or IRR). Optimizing for economics does not necessarily mean drilling and completing the most productive well. It is optimizing to achieve the best economic outcome.
The PetroVisor Completion Optimization workflow does the completion optimization assessment by
- Combining oil and gas cash flow economics with a model that predicts an expected production outcome for a particular completion.
- Creating a production profile forecast that represents a particular combination of well and reservoir properties.
- Using the predicted production profile together with economic inputs to evaluate the merit of that particular completion design.
PetroVisor Completion Optimization
PetroVisor Completion Optimization works by determining the maximum NPV or IRR from a collection of potential completion designs. PetroVisor determines optimal and near-optimal designs by:
- Computing production and well spacing KPI's and loading or computing completion and geologic KPI's for all wells to be used in the Machine Learning (ML) model training dataset.
- Choosing a set of wells (entity set) for training an ML model to predict production KPI's from completion, geologic, and parent/child (well spacing) parameters.
- Generating a time-normalized monthly production Type Curve from the ML training entity set to be used (adjusted) in a completion design evaluation matrix.
- Training a Machine Learning (ML) model to prediction production KPI's from completion, geologic, and well spacing parameters.
- Calibrating economic models to provide wells costs and other economic inputs to conduct cash flow analysis in the completion design evaluation matrix.
- Computing the NPV or IRR of numerous potential completion designs within a completion design Evaluation Matrix by combining the ML model, production type curve, and economic models in an automated workflow.
Key Production Indicators
PetroVisor KPIs are developed from the KPI Package. KPIs are a way to represent the the lifetime performance of a well as a single number. The KPI B90 is the Best 90-day performance of a well. It is a production KPI that is a condensed representation of a well's historical and future performance. The PetroVisor KPI package automatically scans the production profile of the well and determines the B90.
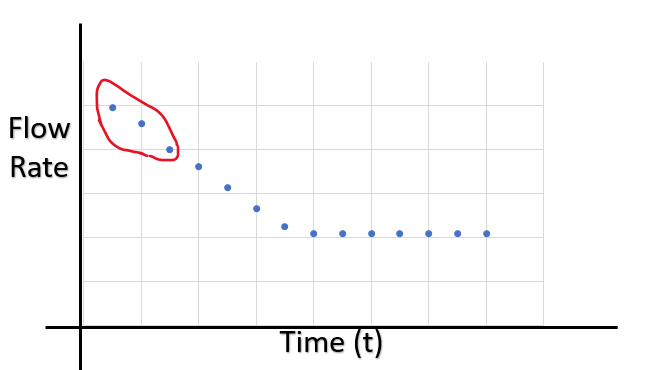
B90 is the average of the Best 90-day window of the production profile
As with most production KPIs, B90 is a proxy for well performance:
Higher B90 correlates to a better well
Lower B90 correlates to a poorer well
A KPI like B90 allows us to have an opinion about a well using a single number, and use that KPI in data analytics regression workflows like MVR, and ML.
Type Curves
A type curve is a production curve or production profile representing a "typical" single well outcome. A type curve can be the actual production from a single well or an average of two or more wells.
A type curve is usually grouped by a common set of characteristics of the wells that make up the type curve, such as:
- only horizontal wells, and
- drilled in a specific horizon, and
- drilled during a certain time period
The criteria shown above are only examples of how to classify wells for type curves. However, a type curve is composed of wells with any criteria that meet the goals and objectives of your particular project.
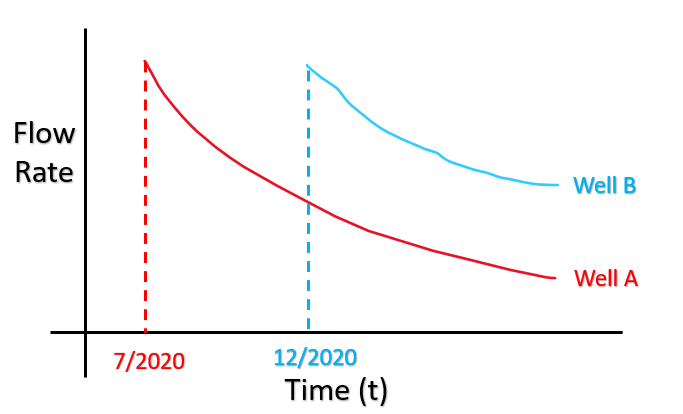
In the example shown above, there are two wells that start production at different calendar dates (July 2020 and December 2020). To combine these two wells production profiles into a single type curve, the Petrovisor Type Curve Package time-normalizes each well's production profile to a common time scale. The time normalization shifts production curves for each well to a common reference point (the first month of production). Then, the values can be averaged at each normalized time.
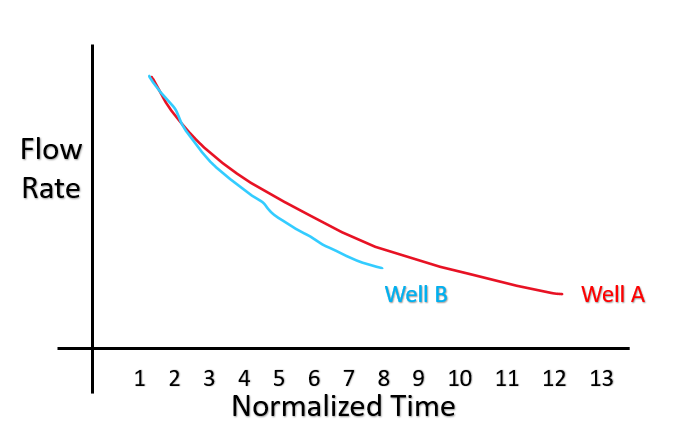
Notice that in the graph above, Well B ends before Well A on the normalized time scale. If this happens, the average production of the two wells at the end of the normalized time scale will be the production from Well A only. This is commonly called survivor bias, and results in a type curve that puts too much weight or emphasis at the end of time on the oldest wells in the type curve well set. PetroVisor solves the survivor bias problem by first performing a DCA forecast on every well. This means that every well has both historical and forecasted production performance, regardless of the age of the well.
The final type curve is then a simple numerical average of all the values for each well at each normalized time step, including both historical and forecasted production volumes. The type curve is stored as a reference table in PetroVisor for later retrieval by the Completion Optimization package or any other package that uses type curves.
Similar to any other actual well, the resulting type curve has a B90 KPI, which is computed by the Petrovisor Type Curve Builder package. This B90 becomes a reference value to compare to the B90 KPIs predicted by the MVR / ML model for each completion design in the completion optimization study.
Simple ML Model Predicting a Production KPI

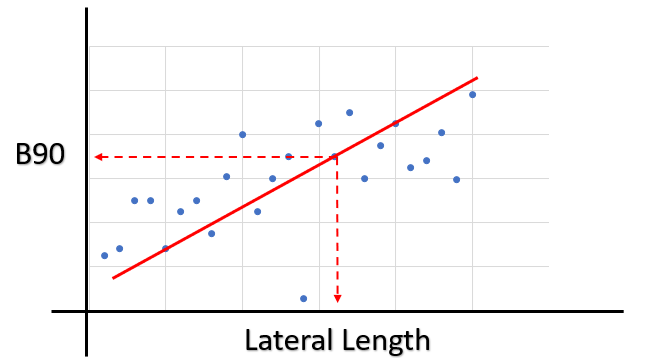
Where B90 is the best 90 days of the well and a function of Lateral Length.
For this example, let's assume that the correlation above is our proxy for an ML model. It is a single-variable relationship of the B90 KPI to lateral length. Note that since the outcomes shown in the example would be based on real data, it is also reasonable to use this relationship to predict B90 from lateral length for any new wells we want to examine.
Completion Optimization Workflow
For Completion Optimization, PetroVisor examines how different completion designs result in specific outcomes of production performance and economic performance. It is typical for a completion optimization study to have hundreds or thousands of trial designs that are examined in the study.
The four-step process outlined below is repeated for each completion design case to evaluate a broad set of completion designs.
PRE-REQUISITES
Run The Petrovisor Production Forecasting (DCA) Package
The completion optimization workflow requires a type curve that is derived from a combination of historical and forecasted production volumes. This requires a DCA analysis using the Petrovisor Production Forecasting (DCA) package, which is a rules-based, multi-pass DCA fitting and forecasting package.
Build An ML Model For A B90 KPI Prediction
This model is used to predict a B90 KPI from a defined set of completion and reservoir inputs. In our example, we are using a simple model that relates B90 to lateral length. In reality, B90 is a function of many input variables, which is where Petrovisor's ML package and workflows can assist with creating these more complex models.

B90 = f(lateral length)
Create A Type Curve
Create the project type curve by defining the selection criteria that define the wells that make up the type curve. After running the Petrovisor Type Curve Builder package, the resulting type curve and associated B90 KPI are stored in the Petrovisor database.
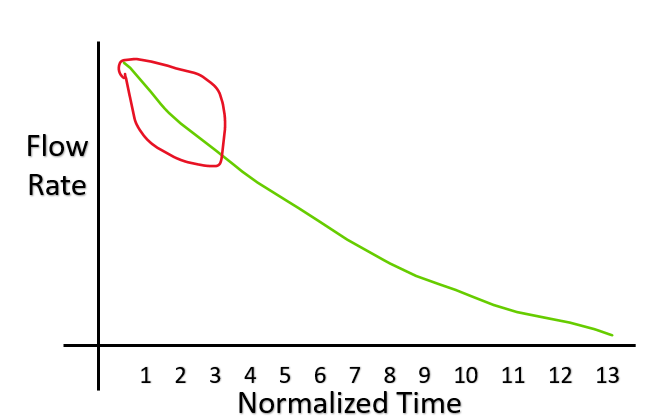
1. Production Profile
2. B90 KPI of type curve
Prepare Economic Inputs
Before beginning a completion optimization study, the economic inputs used in the Petrovisor Economics package must be clearly defined and input into the Petrovisor database. The economic inputs include commodity prices, capital costs for wells (drilling, completion and tie-in), operating costs, royalties, taxes and inflation factors.
COMPLETION OPTIMIZATION WORKFLOW FOUR-STEP PROCESS
Step 1
For each completion design, the workflow uses the design's assigned lateral length and predicts a B90 KPI from the ML model.
Step 2
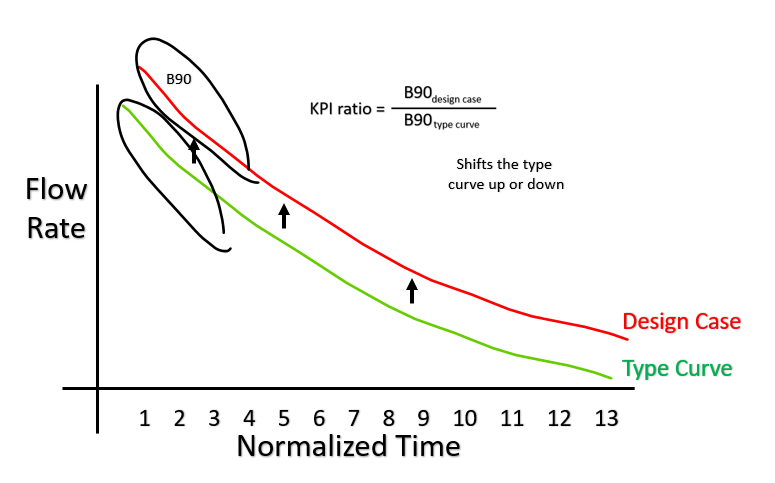
Calculate the KPI ratio between design case and the type curve.

Step 3
Scale the production profile of the design case using the KPI ratio from Step 2 and the type curve profile built for the completion design project.
Step 4
Use the production profile of the design case and the Petrovisor Economics package to calculate the economic merit of this particular case.
The PetroVisor Economics Package does use the provided economic inputs associated with the variables that generate revenue (oil, gas, condensate) and variables that cost money (well capital cost, operating costs, royalties, and taxes.)
These four steps of the Completion Optimization workflow are repeated for each of the completion designs (which may be hundreds or thousands of cases), resulting in a visualization of the results shown below.

For this example, the visualization indicates which specific lateral length results in the most favorable economic outcome.
This is the PetroVisor Completion Optimization workflow.
Multivariable Example
In this simple example, only a single variable was used for illustration of the prediction model that would be used to predict a B90 KPI.

In reality, there is a more complex relationship between KPIs like B90 and multiple explanatory variables. Petrovisor uses multi-variable regression and machine learning techniques to find higher-dimension relationships between multiple variables and KPIs like B90 and estimated ultimate recovery (EUR). Techniques like ML build and utilize these multi-variable relationships to make predictions that are used in other Petrovisor workflows like Completion Optimization.
PetroVisor uses machine learning to build complex models involving several parameters associated with how wells are drilled and completed.
- Total Depth
- Number of stimulation fracture stages
- Quantities of proppant and fluid
- Lateral length
- More
Conducting Completion Optimization In PetroVisor
For the Completion Optimization to work in PetroVisor, the Completion Optimization Package and all required inputs must first be set up in the workspace. This is typically done by Datagration during the initial implementation. Requirements are defined in the package documentation: Completion Optimization Package.
Once the Completion Optimization package is installed, the computation of KPI's, production type curve generation, ML model training, computation of evaluation matrix KPI's and dashboard update are all performed via automated workflows. Those workflows and the human involvement (entity set selection, inputs calibrations, and various settings) within the overall workflow are detailed in the eight numbered sub-sections found withing the Completion Optimization section of the Knowledge Base.
