ESP Monitoring
The dashboard monitors the performance of wells equipped with ESPs, detects a number of operational challenges that wells might be experiencing, and suggests actions to solve them.
Usage and Configuration
Follow the steps given in How do I configure packages pulled from Datagration's package repository to change the configuration of the package.
Use the workspace value EspMonitoringDashboardTargetScenario to define the scenario target production data is pulled from.
When opening the template for the first time, several options for configuring the dashboard are shown. To fully configure the dashboard specify the following required parameters.
Workspace - Specify the workspace the data shall be pulled from
Entity Set Name - Specify the name of the entity set used for pulling Surveillance By Exception tag entries to the dashboard. If the default schedules and entity sets are used, set this parameter to Current ESP Wells
Scenario Name: Specify the name of the scenario were the target {phase} production per time increment and target {phase} production rate signals will be saved/retrieved. To do so, please specify the name of your scenario in the deticated workspace value EspMonitoringDashboardTargetScenario.
Tag Entries First Date - Specify the date from which on forward the Surveillance By Exception tag entries shall be pulled in. The format for this date string is yyyy-MM-ddTHH:mm:ssZ
Optionally, the instance to connect to and the units for pulling the data in can be selected using the provided drop-downs.

Ignore privacy levels checks to ensure that the dashboard works as intended.

Gateway Setup
When setting up the gateways in PowerBI, make sure to skip the connection test and set the privacy level to "Organizational":
Dashboard
The ESP Monitoring Dashboard consists of five (5) tabs.
- Summary
- Production
- Performance
- Problem Detection
- Parameters
Filter
Each tab of the dashboard features a date slicer and filter on the left side of the tab. The filters allow the user to select specific dates, as well as specify fields and individual wells.
Summary
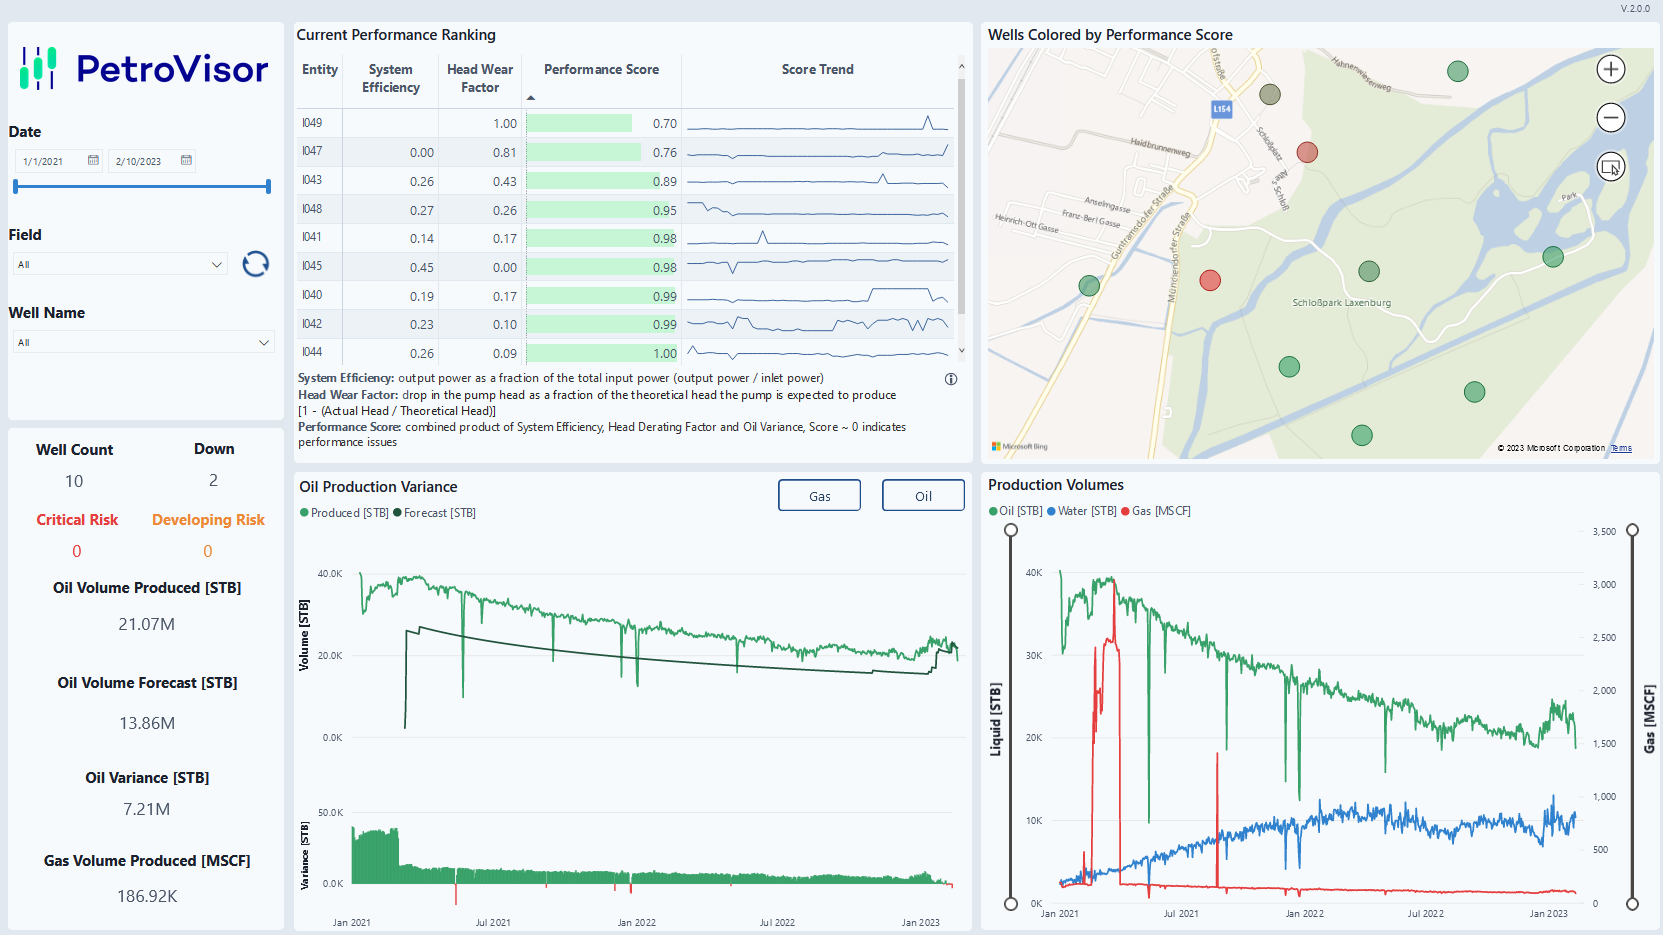
The summary tab gives an overview of the well's production performance over time, as well as versus the set target production. It also shows operational challenges or problems in the form of a performance ranking.
Production
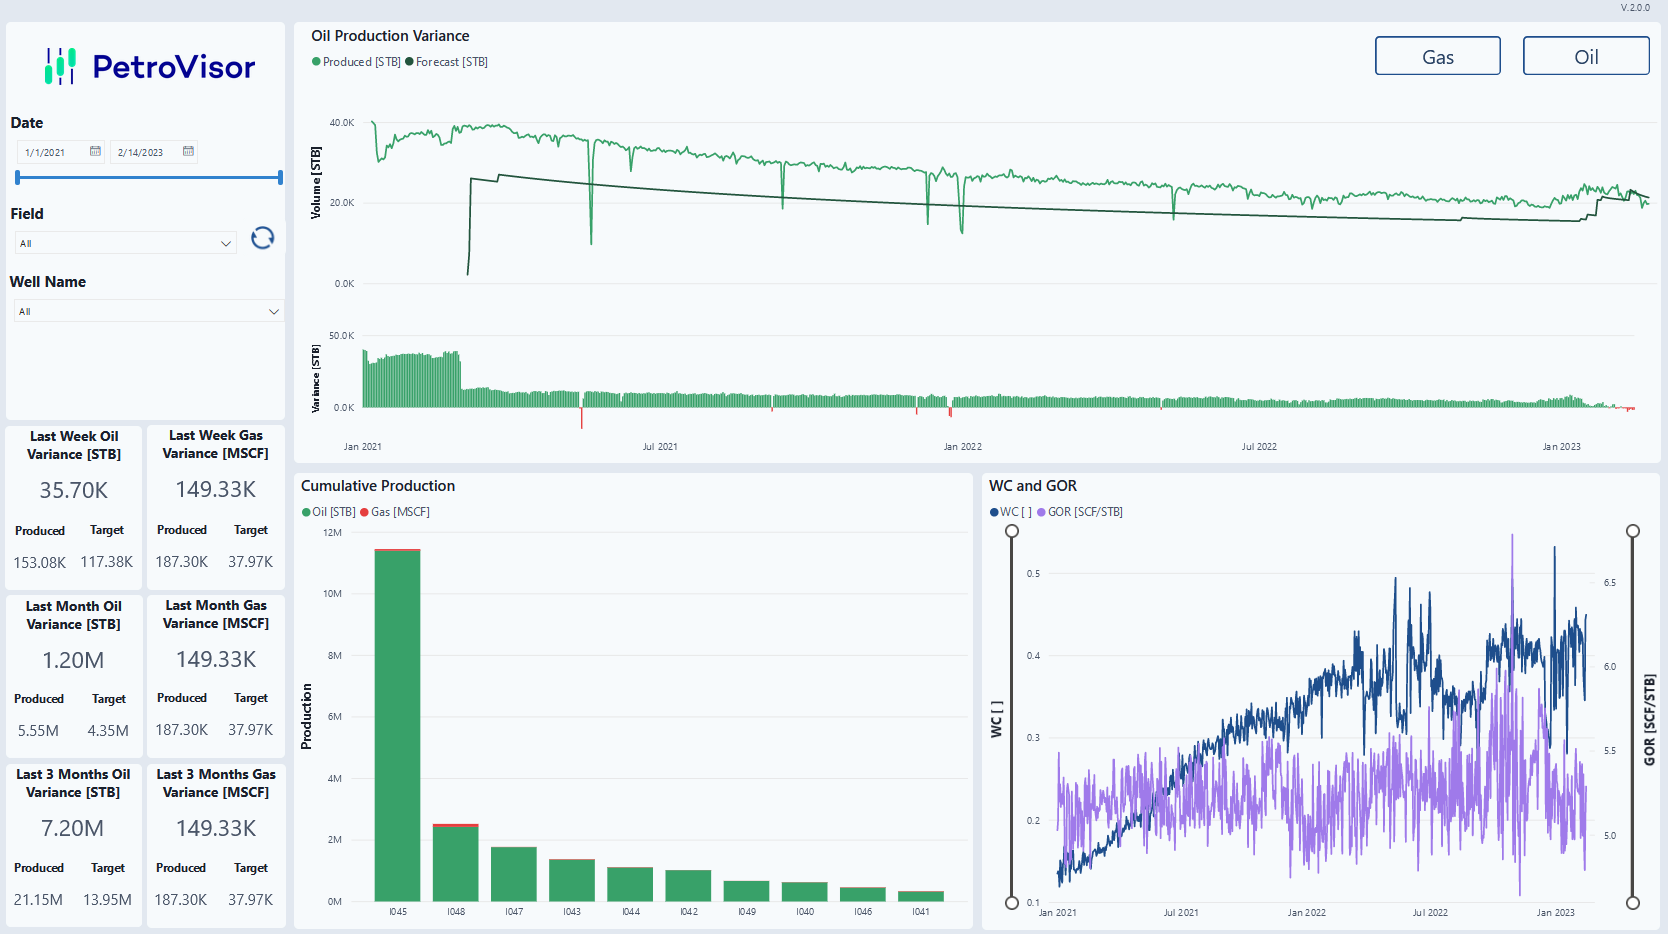
The production tab provides an overview of production forecast, variances and critical production parameters that influence ESP performance.
Performance
The performance tab provides an overview of how the ESP is performing. By selecting a single well, KPIs for the pump are displayed over time.
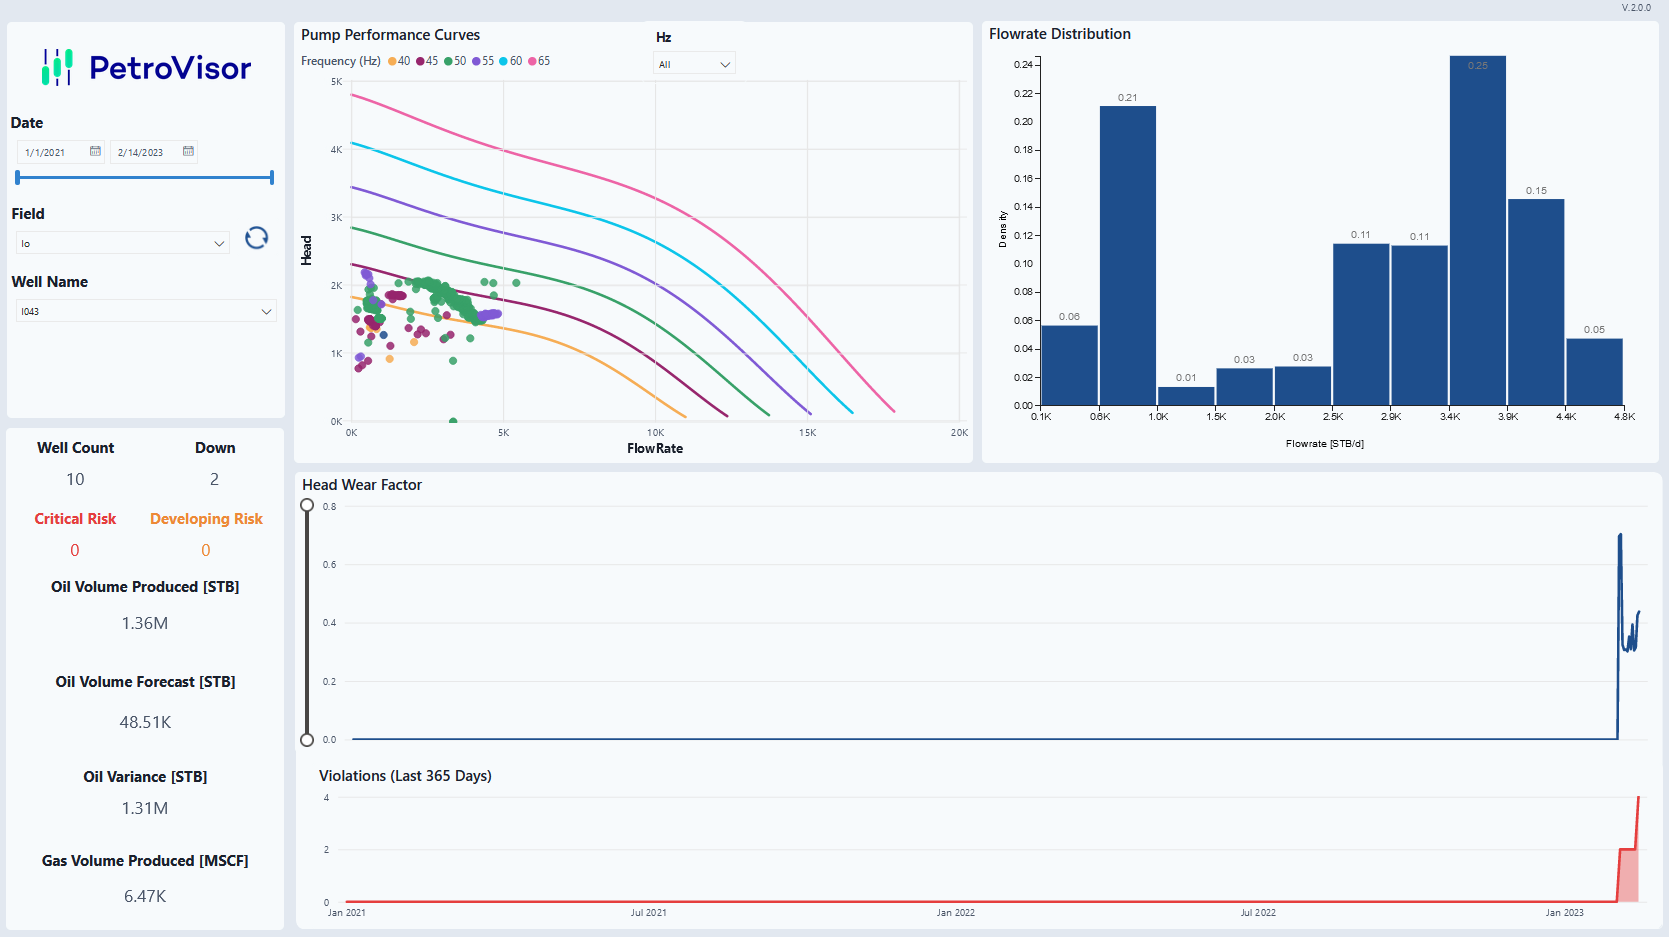
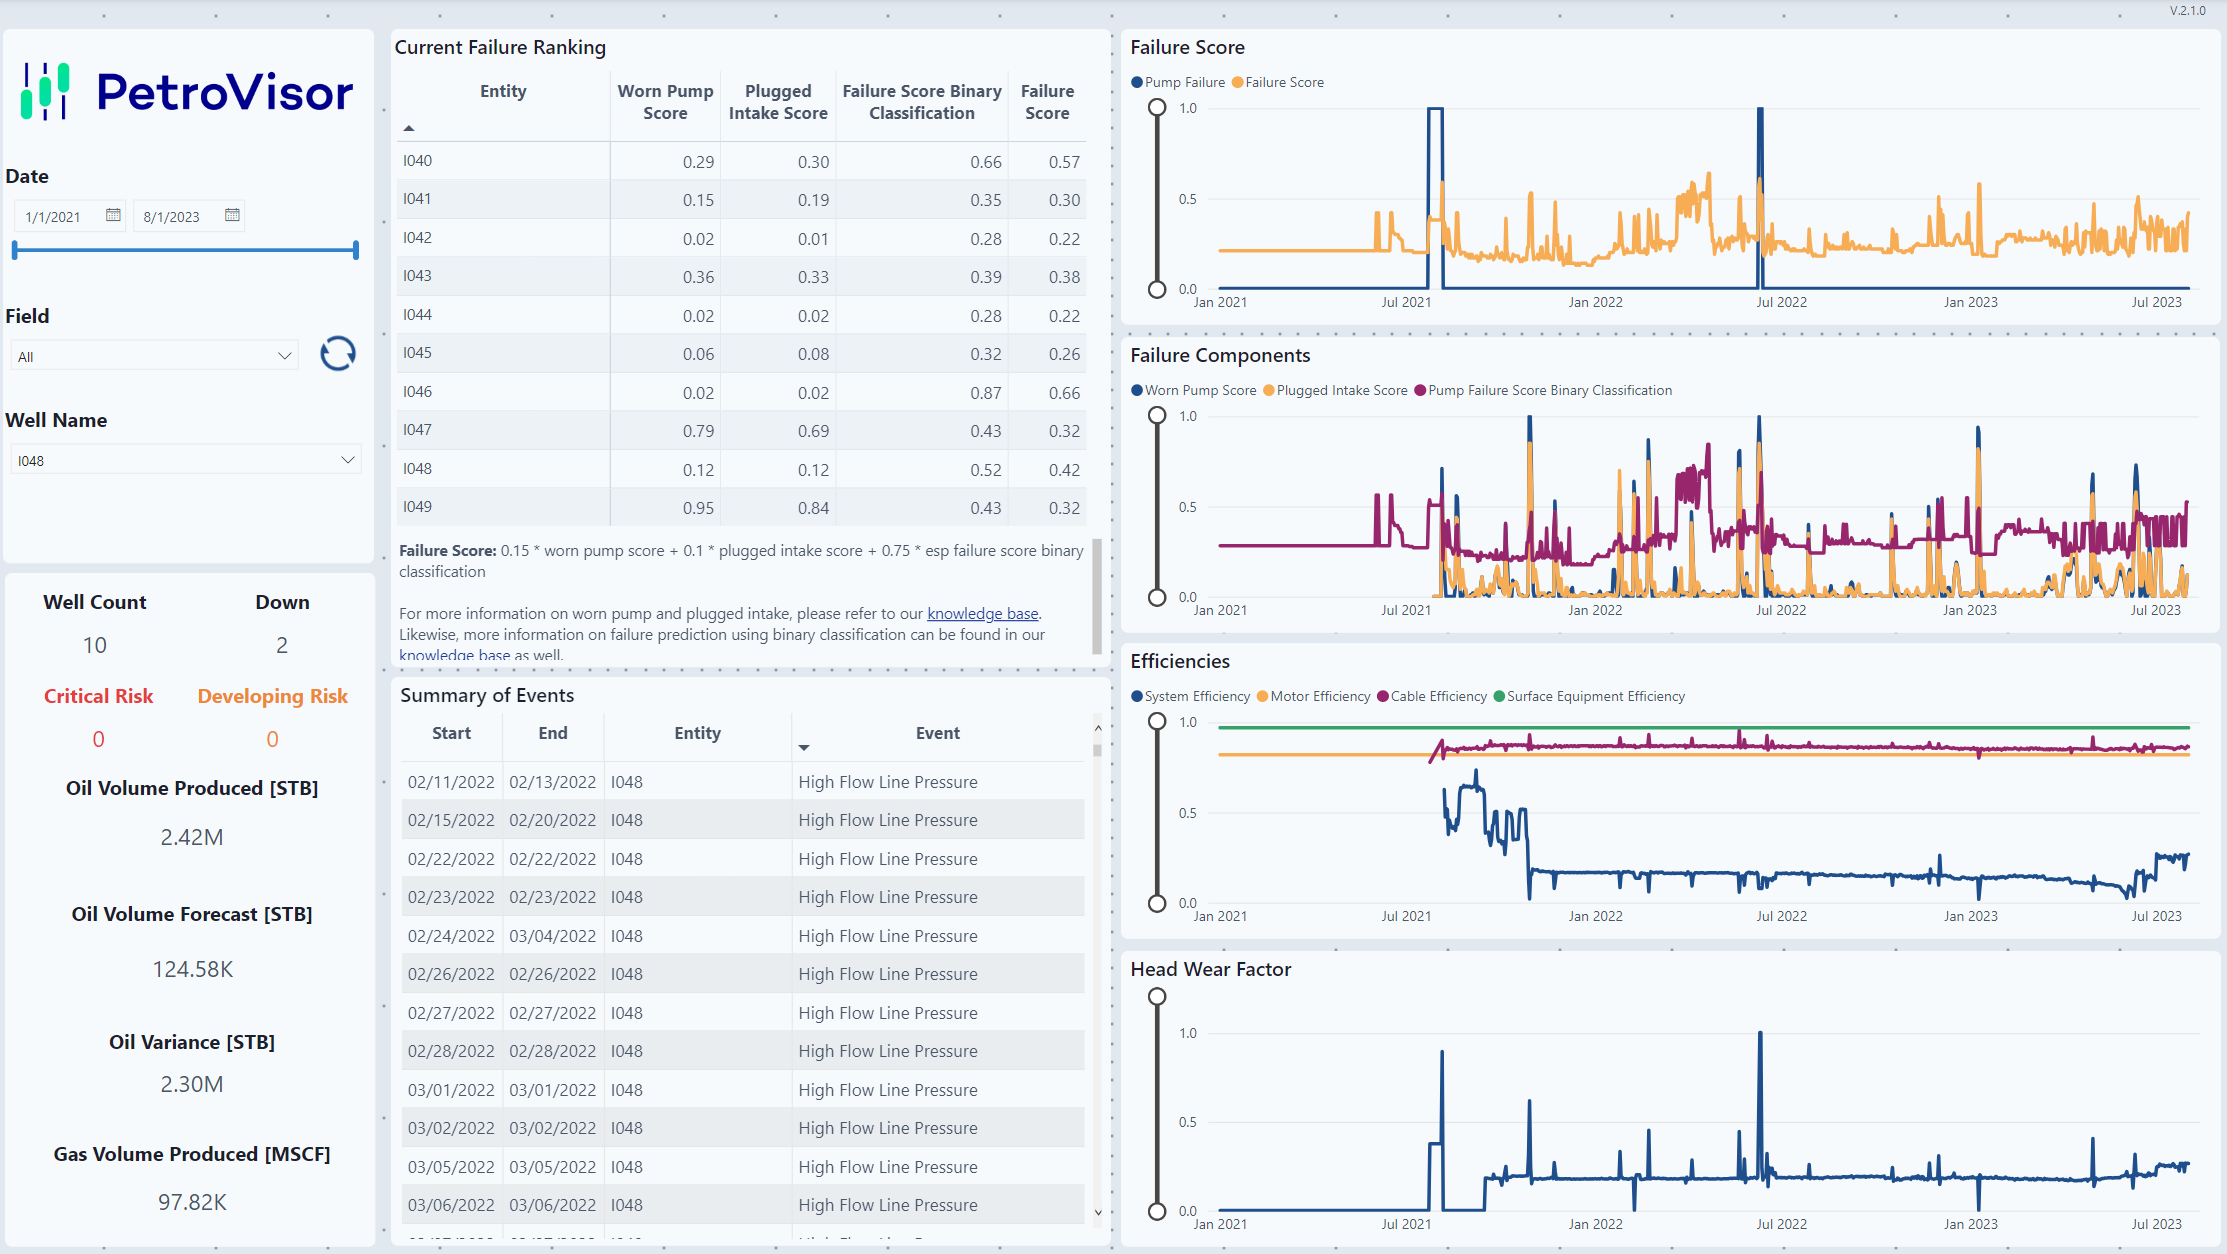
Failure Analysis
The failure analysis tab provides field operation management with a concise overview of problematic or potentially problematic wells.
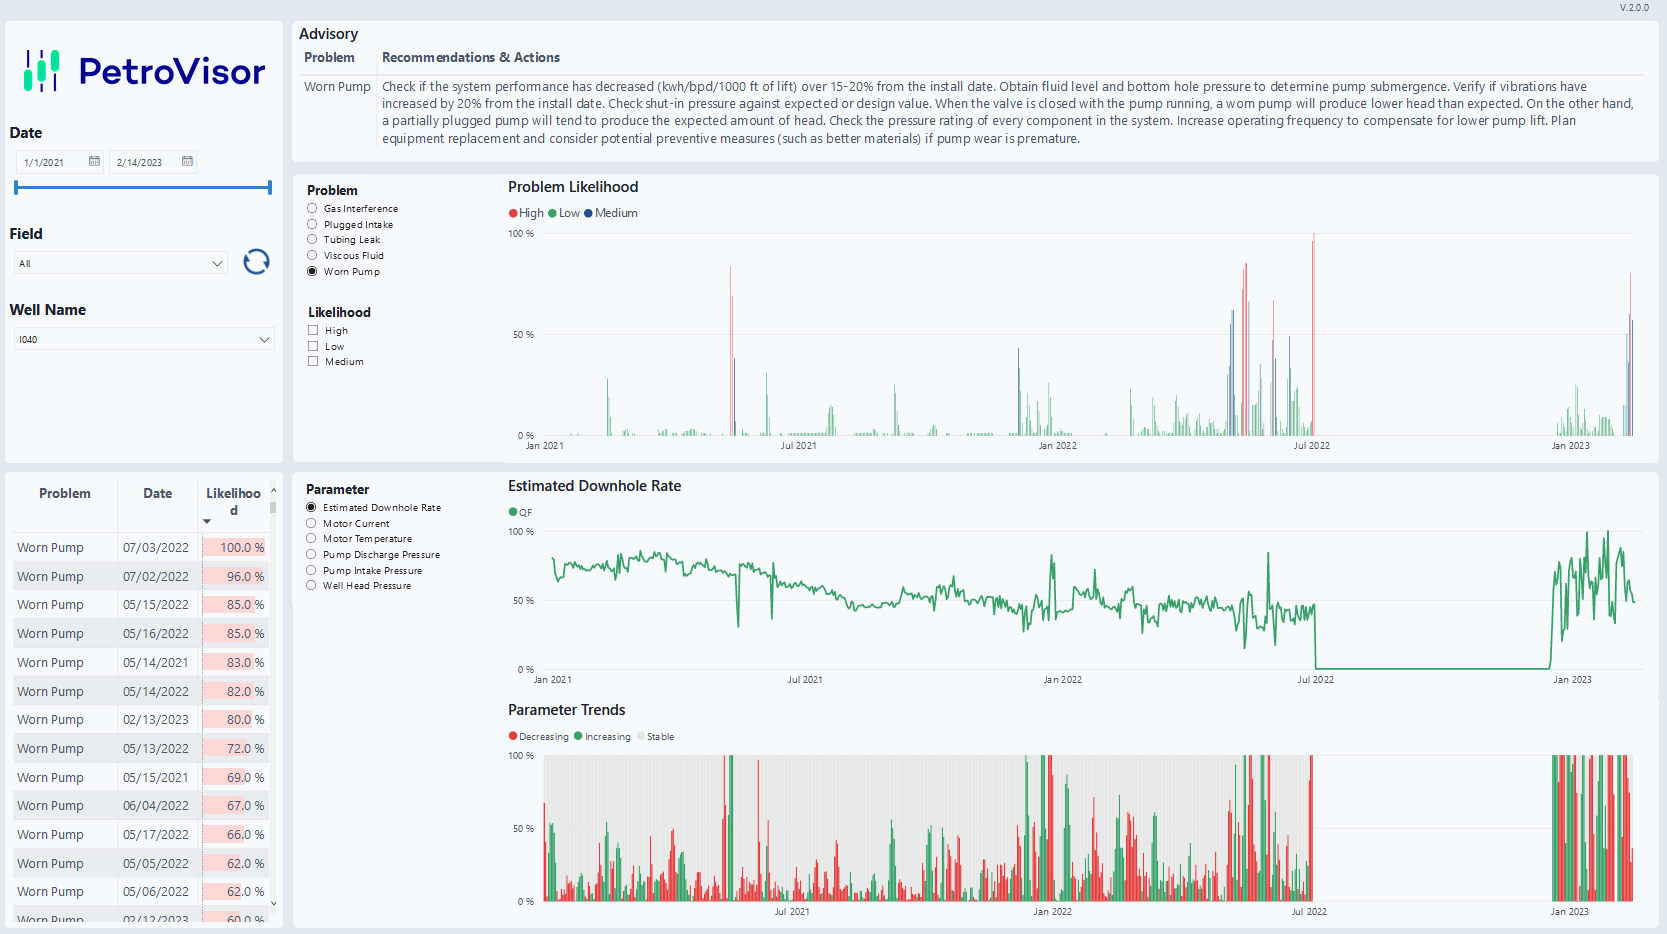
Problem Detection
The problem detection tab shows the the likelihood of industry known ESP problems that may cause an ESP to fail. Moreover, a concise advisory detailing industry known suggestions to solve these problems is given.
Parameters
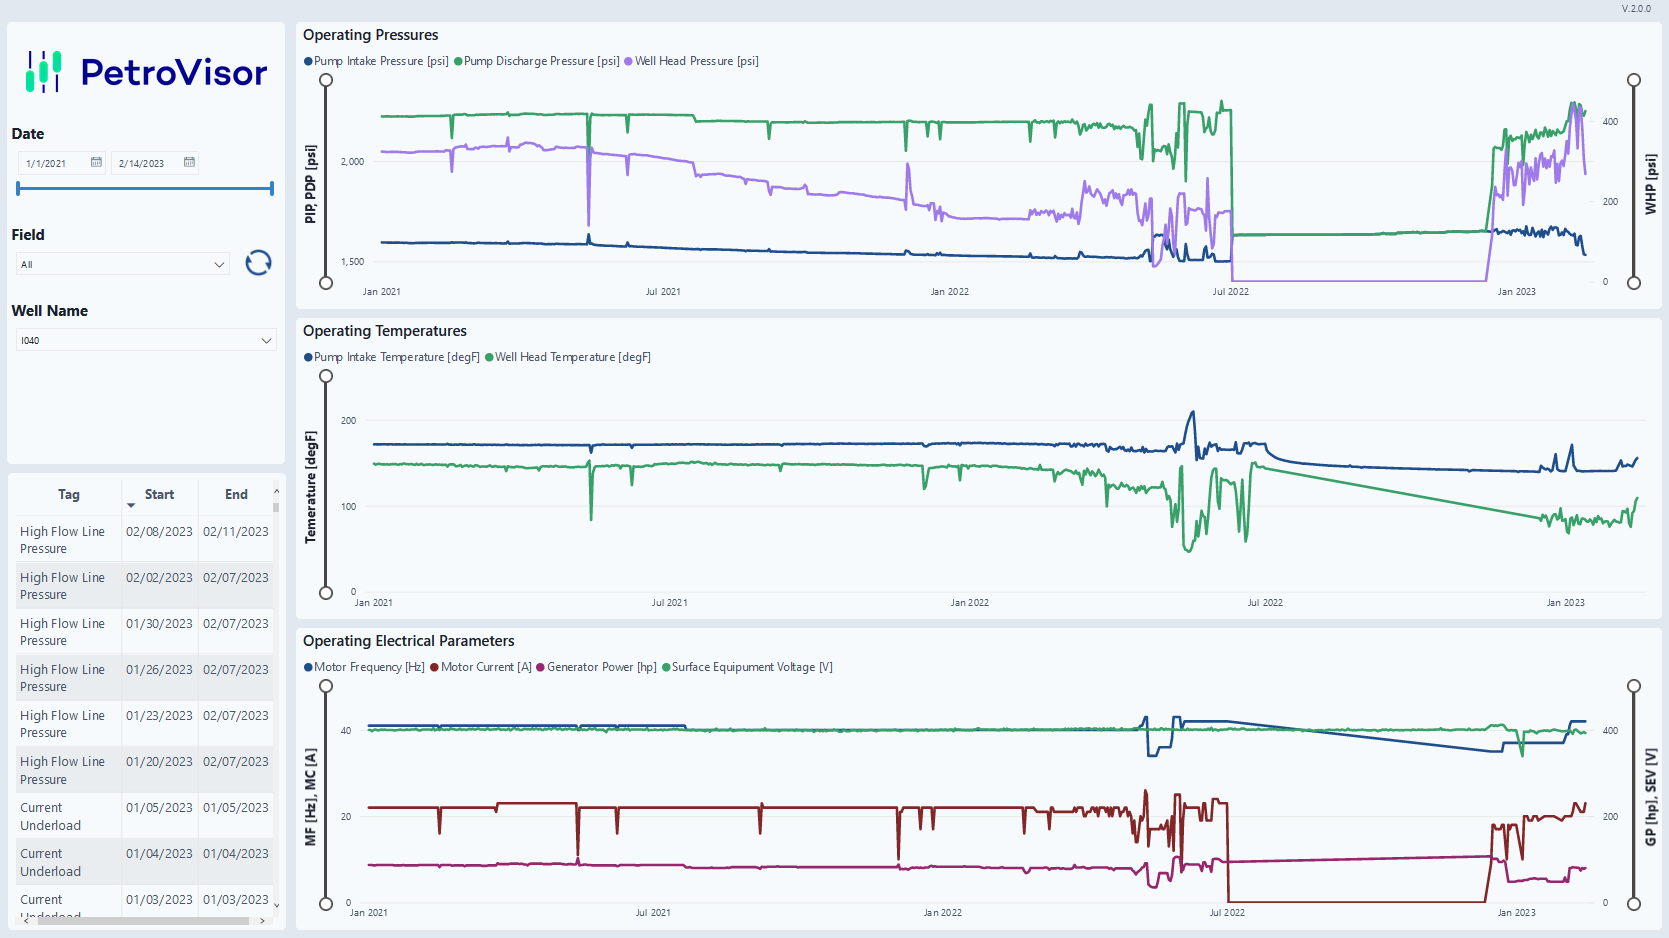
The parameters tab shows raw data from the client's data source that are key in monitoring and analyzing ESP performance.
