This is a list of Datagration Best Practices when working in Power BI.
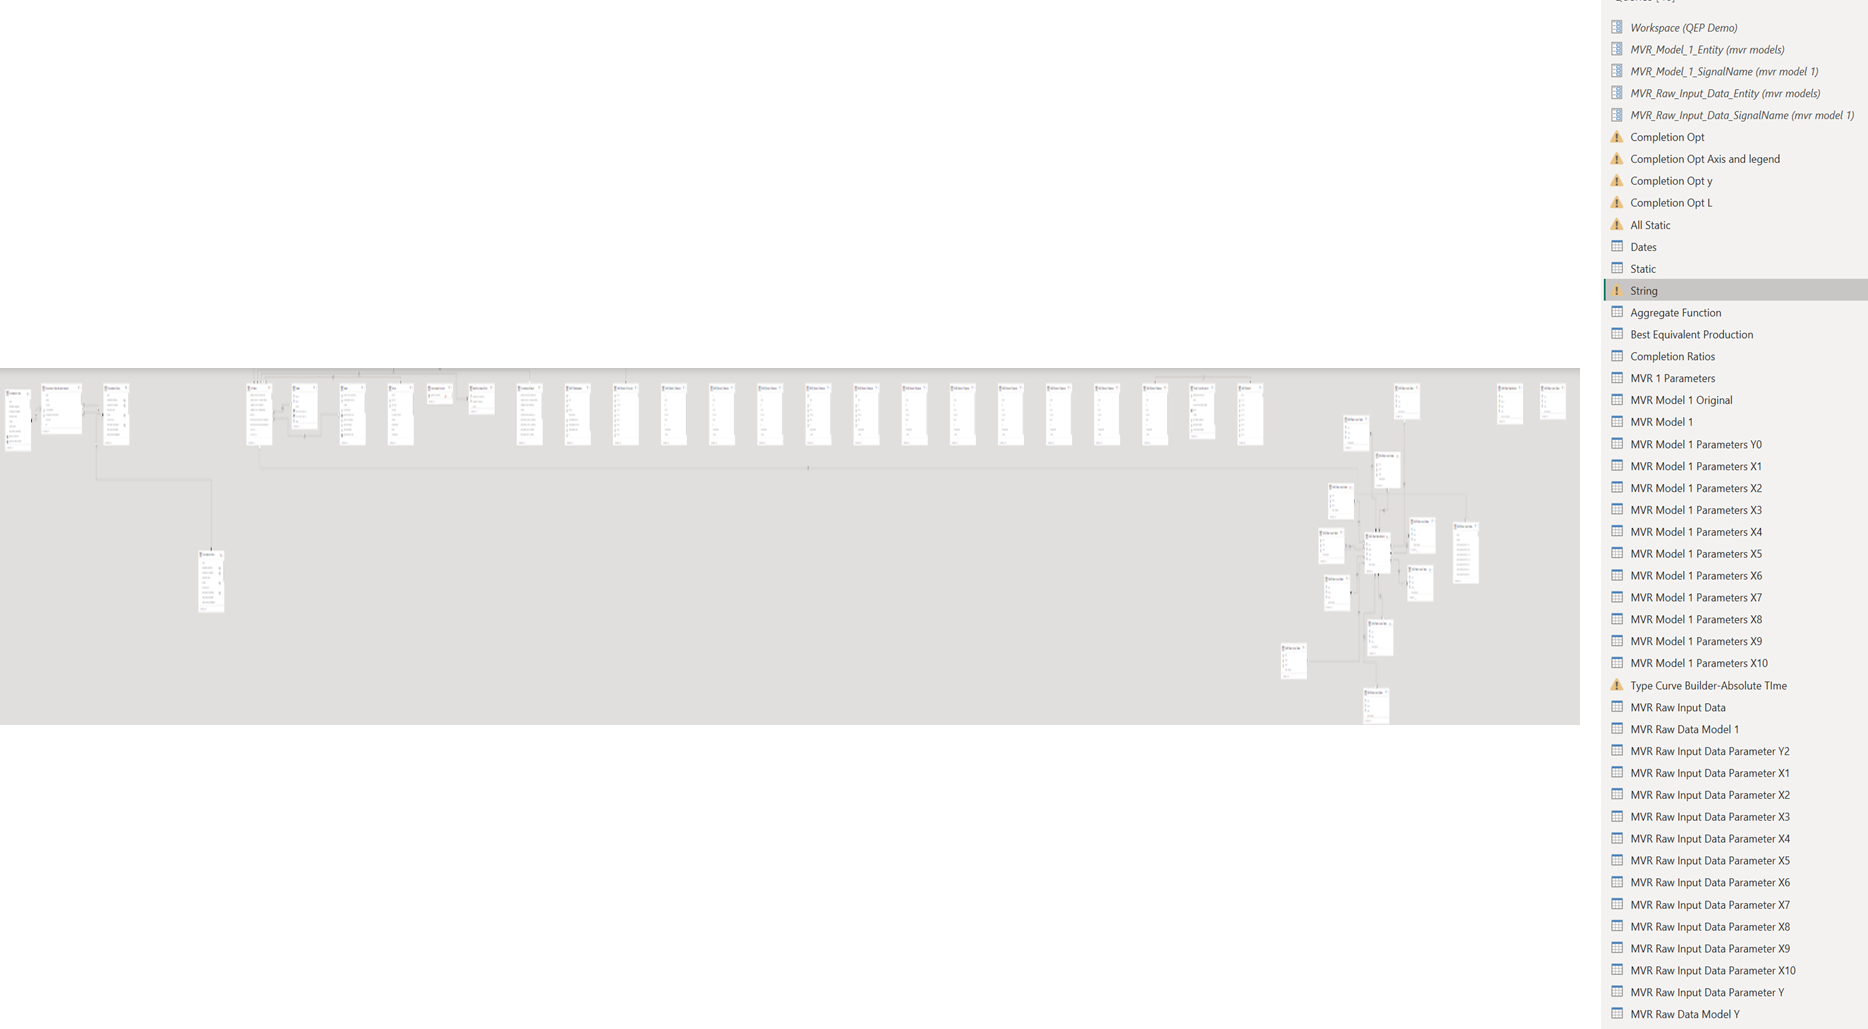
Don’t start With A Copy Of An Existing Dashboard
If this is a brand-new concept, always start with a new pbix file and try not to work on top of an existing file. Starting with an existing dashboard can create too many sources and will end up taking someone else's time in the future.
Even if it seems that it's easier to start working on top of an already existing database, it will end up taking someone else's time in the future.
Starting with an existing dashboard can create too many sources.
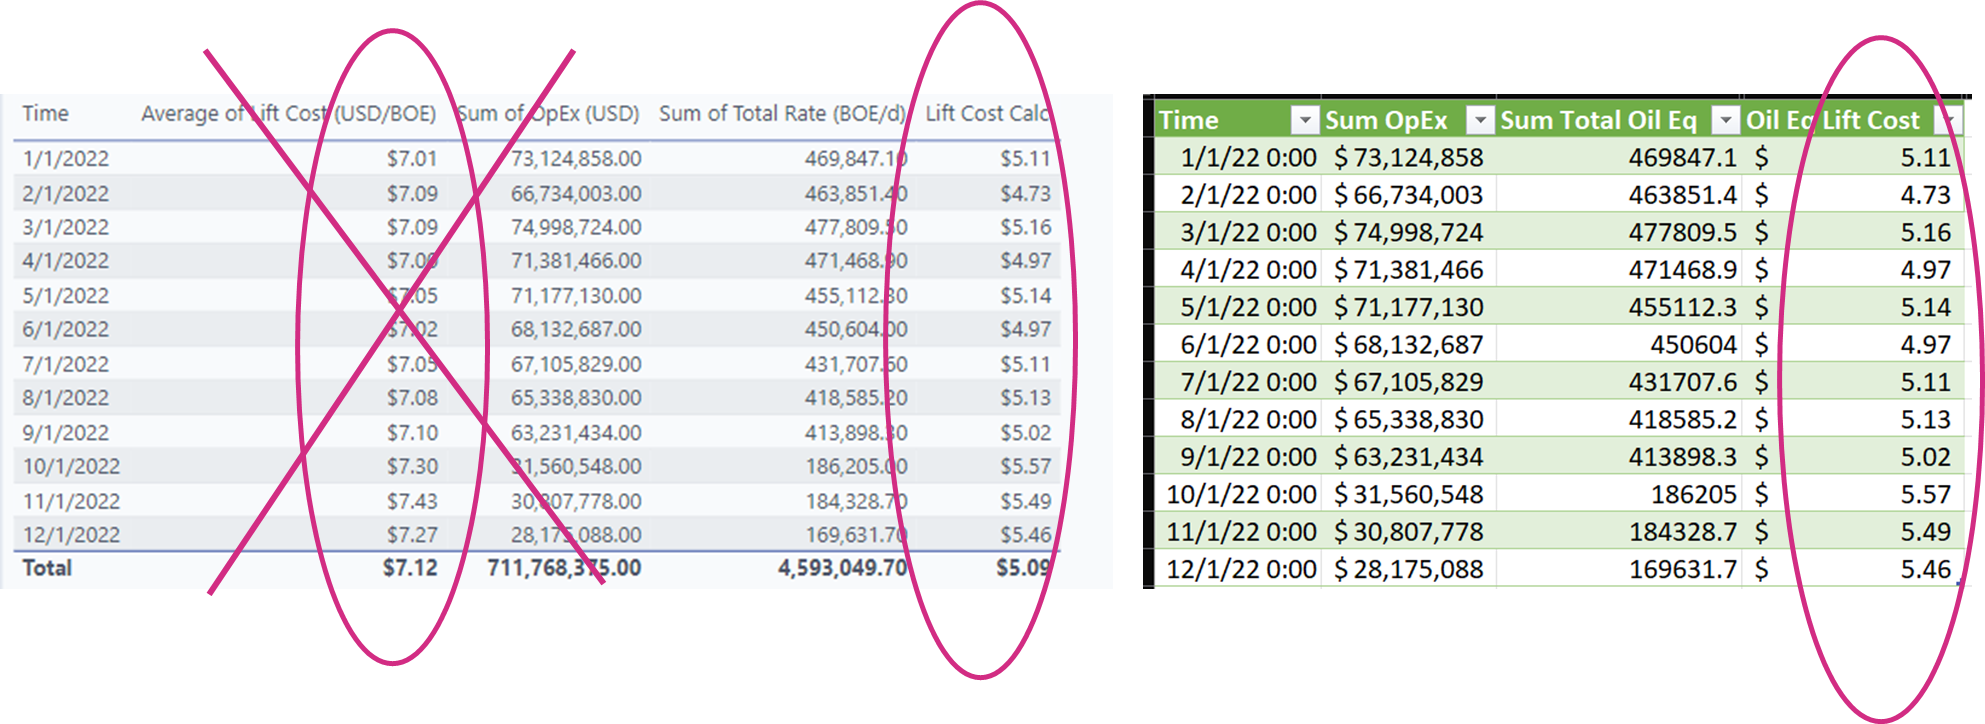
Create benchmarks of complicated calculations in Excel
Some calculations in Power BI do not give the exact answer.
Example: Lifting Cost
Selecting ‘Average’ as an aggregation when creating visuals in Power BI will average lifting cost over a given time period.
Lifting Cost needs to be calculated as a sum of opex/sum of usd*30.4375 instead of an aggregation of something that has already been aggregated in Petrovisor.
For these types of calculations, its best to determine what is needed ahead of time and then aggregate via dax calculations in pbi.
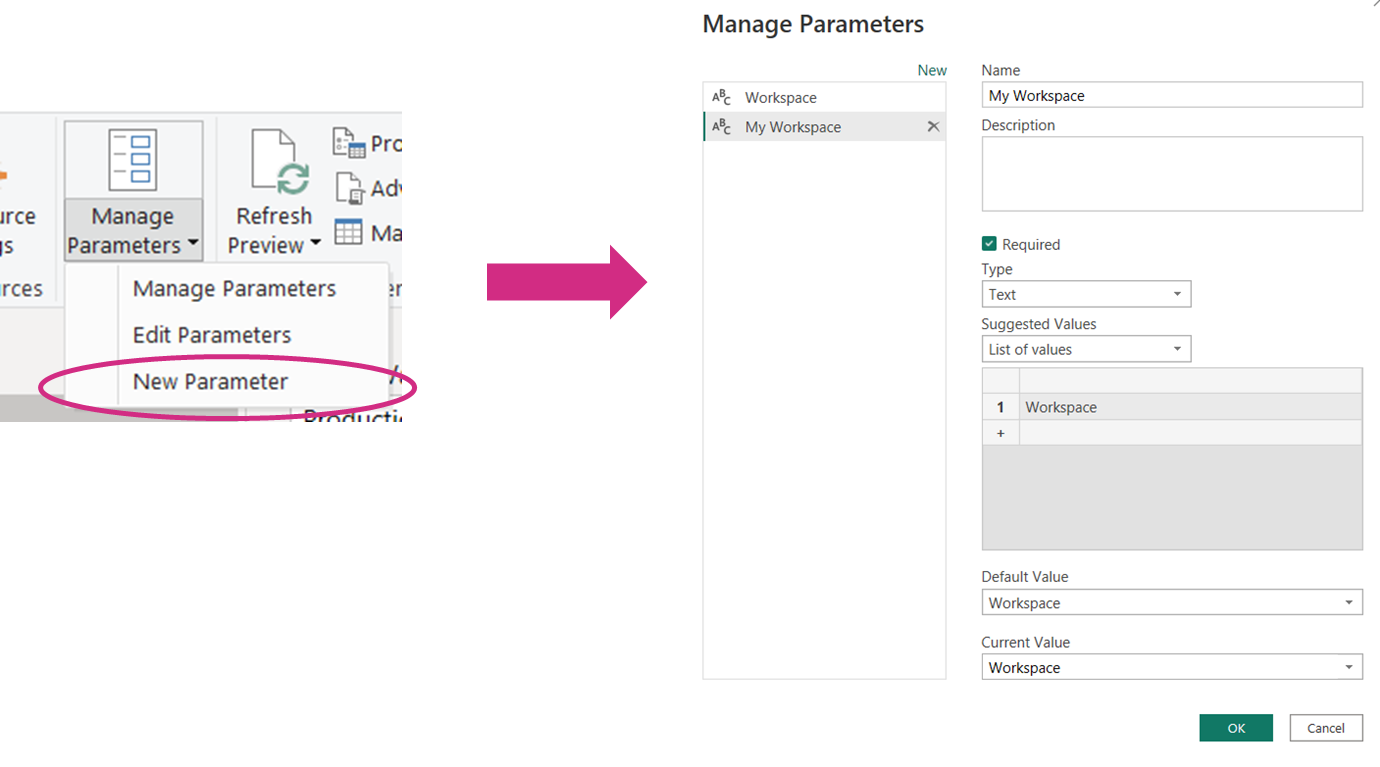
Parameterize The Workspace Name
It’s important to get into the habit of creating the parameter in power query that is used to reference the workspace and avoid typing out the name of the workspace in the Source step. This will make changing the workspace value a lot easier in the future.
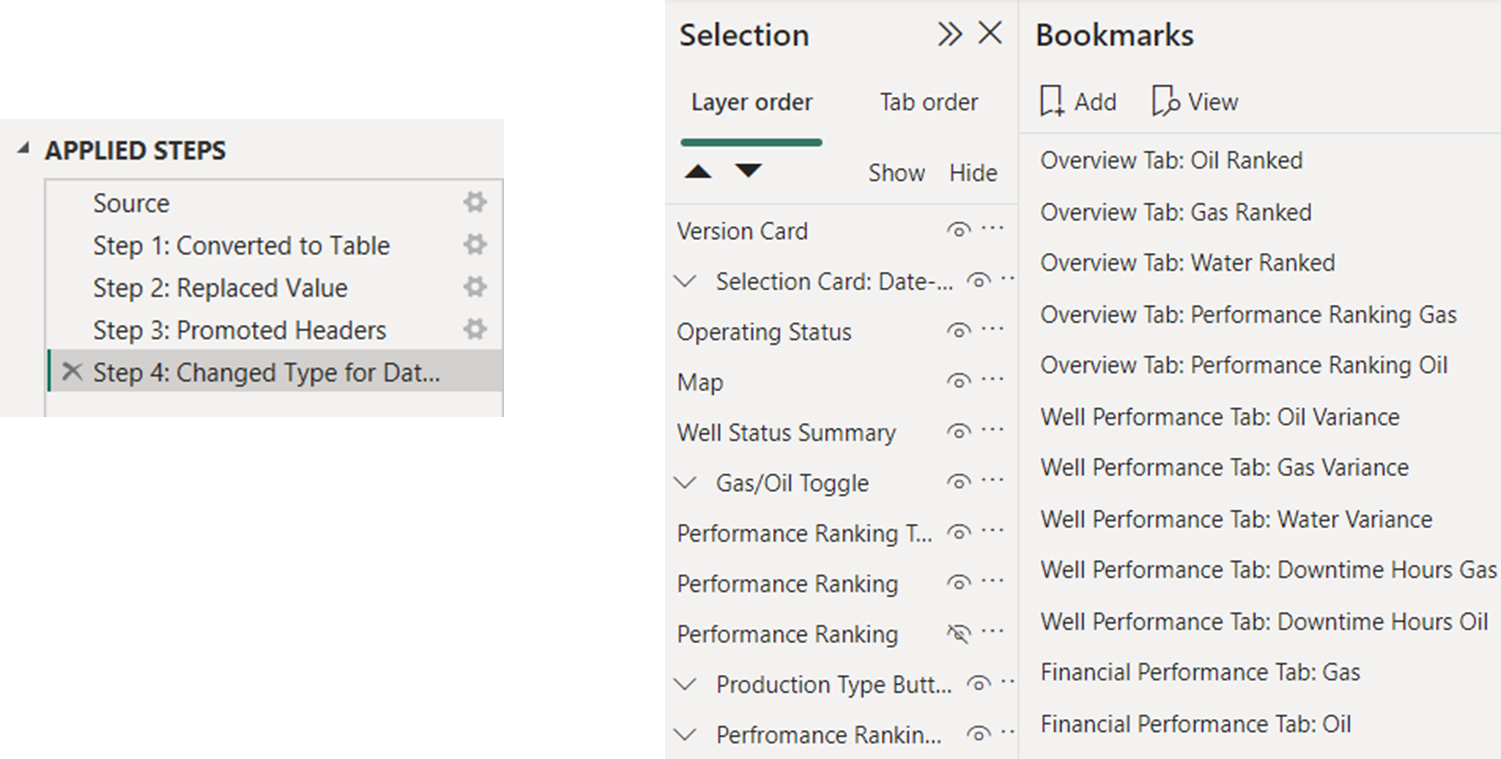
Name Your Steps
NAME your Power Query Steps and to visuals so they are easy to understand.
Clean House
Delete Items no longer in use such as queries, DAX code, bookmarks, calculated tables & columns.

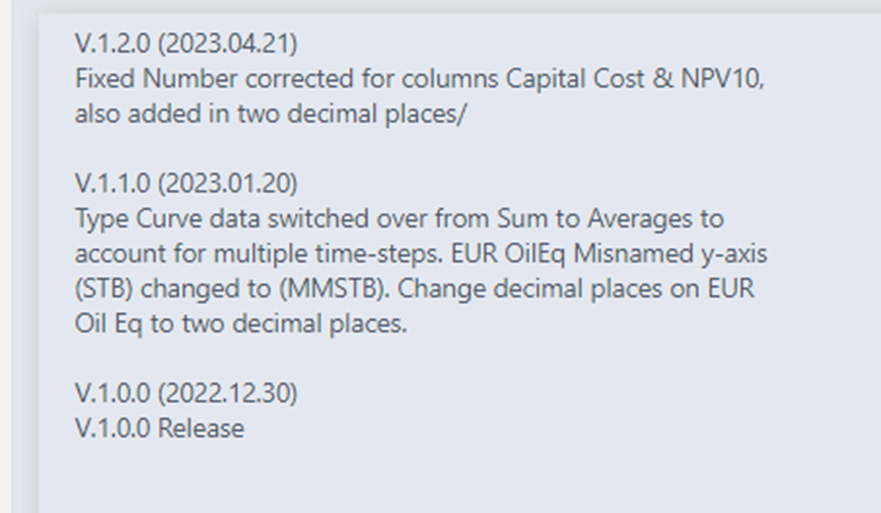
Keep A Change Log
Utilize the Update Tab: use the Update Tab in dashboards to start and maintain a change log of your work along with using versioning in your dashboard so you and the audience know which version they are looking at.
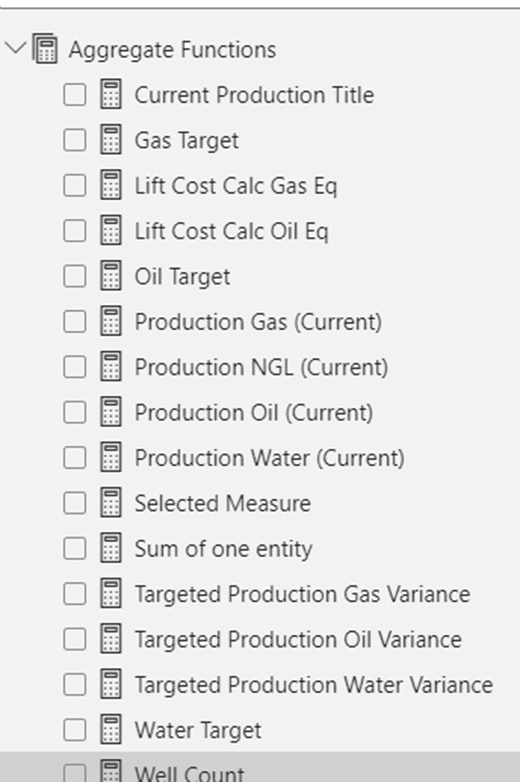
Group Your Measures
Use an Aggregate Functions Table for any measures created.
Helpful Hints
Do’s
- DO make your schema easy to understand. Do this by using DIM Tables and FACT Tables.
- DO calculations in P# rather than creating them in PowerBI as much as possible.
- DO disable Automatic Relationship detection when you load your data into the data model from power query – do not let PBI determine relationships for you!
- DO create an ENTITY DIM Table and a DATES DIM Table and use those to build relationships to your FACT Tables.
- DO think about the end use of your dashboard and what flexibility you can build into your P# scripts and Pivot Tables. For example, if your dashboard design includes visualizations using equivalent volumes (oil BOE or gas MSCFE), include both in your P# code and pass them to PBI.
- DO reach out to Nataly if you are stuck on something for more than 15 minutes.
Don’ts and NO NOs
- DON’T create an abundance of sources. Remember – two types of data – static entity data and time series data. Group these data into as few sources as possible.
- DON’T build Power Queries with too many steps/calculations.
- DONT create too many relationships.
- DON’T use Many-Many Relationships.
- DON’T connect Fact Tables to each other.
