The Completion Optimization workflow steps and required skill sets.
Training Document for Entity Set & ML Model
What is the Completion Optimization Workflow?
The PetroVisor Completion Optimization workflow consists of eight automated main components designed to guide key business decisions related to completion designs. The workflow steps are carried out sequentially, as illustrated below. Users select configurations for each step to customize it according to their specific requirements.

What skills are needed to conduct Completion Optimization in PetroVisor?
The Completion Optimization workflow does require the user to make choices along the workflow. The successful implementation and execution of the Completion Optimization module necessitate a diverse skill set often requiring a team. Below are the required key skills:
- Production Forecasting: Understand the Arp's hyperbolic equation, exponential tail declines, and Estimated Ultimate Recovery.
- Completion Designs: Ability to source and QC completion parameters such as completed lateral length, stages, perf clusters, proppant and frac fluid volumes, injection rate, identify various completion technologies (plug and perf, open-hole sleeve, etc.), and distinguish between various fracture fluid systems.
- Development Parameters: Wells per pad, well spacing.
- Geology: Porosity, net pay, water saturation, permeability, and zone tops in relation to landing/completion zone.
- Machine Learning: The ML module has considerable domain expertise embedded in default values, however the user will benefit by knowing several basic concepts such as parameter transformations, outlier detection and removal, correlation coefficient, p-value, confidence level, Variance Inflation Factor (collinearity), over-fitting indications, feature importance, and identification of interpolation/extrapolation conditions.
- Economics:
- Well Costs as functions of TVD, lateral length, fracture stages, proppant and fracture fluid volumes, perf clusters, MOB/De-MOB costs for drilling and completions.
- Other Eco Inputs such as operating expenses, royalties, abandonment costs, commodity prices, gas plant extraction efficiencies and NGL yields.
- Business Decisions: Which KPI to optimize, the operational/economic trade-off between optimal and near-optimal designs.
Links to details
Package
Completion Optimization Package - Instructions for initial package deployment
'How To' Instructions
The links immediately below are detailed 'How To' instructions to conduct a Completion Optimization study in PetroVisor.
4. Generate Prodcution Type Cuve
6. Calibrate Economic Models
Completion Optimization workflow steps summaries
1. Load Data
In the data load step, client and/or public data is mapped and imported into PetroVisor. The type of data needed includes:
- Well Header (including latitude and longitude of at least surface and toe)
- Production
- Completion
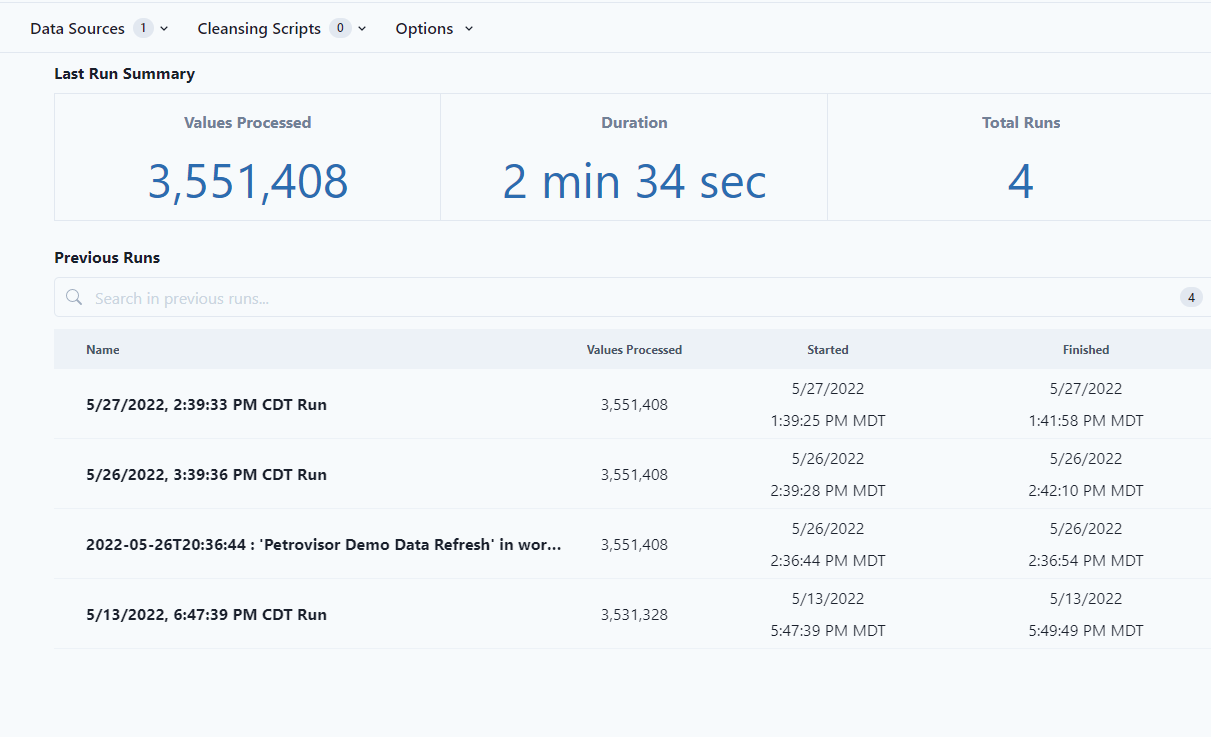
- Geologic Information
2. Forecast Production and Compute KPI’s
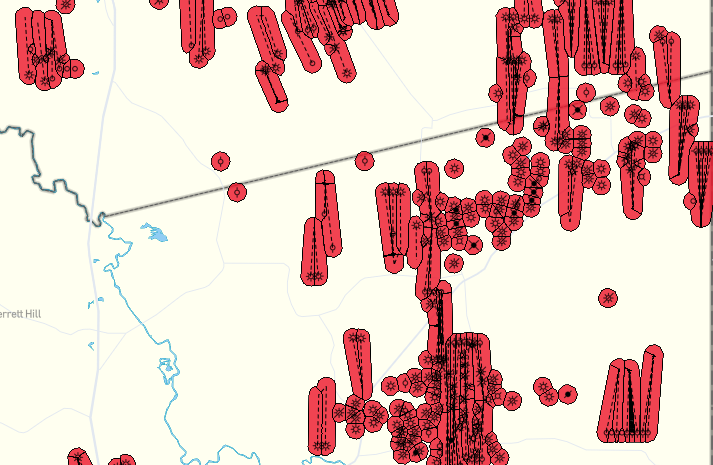
Several automated workflows forecast production on individual wells, compute Voronoi polygons around every well, and compute a variety of production, well spacing, and completion KPI's for each well. Prior to running these workflows the user will choose formations for Voronoi calculations and AutoDCA defaults. Several dashboards allow data QC and further edits to the DCA forecasts if needed.
Client decisions:
- Choose formations for Voronoi grids
- Select AutoDCA defaults
 Automated Workflows:
- Voronoi workflows
- AutoDCA workflows
- Assign geo data to wells
- Production and completion KPI's
Some of the KPIs included:
- B90 (~IP90), EUR
- Completion parameter per stage, cluster, or foot
- Well spacing, wellbore azimuth
- Geo parameters
- Voronoi maps
- Production Forecast (DCA) Review


- Production Summary
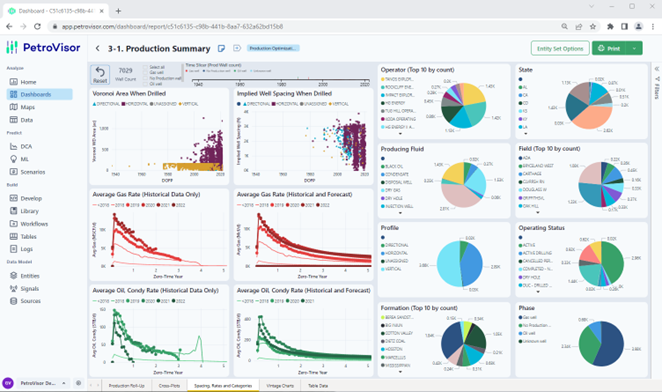
- Completion Summary
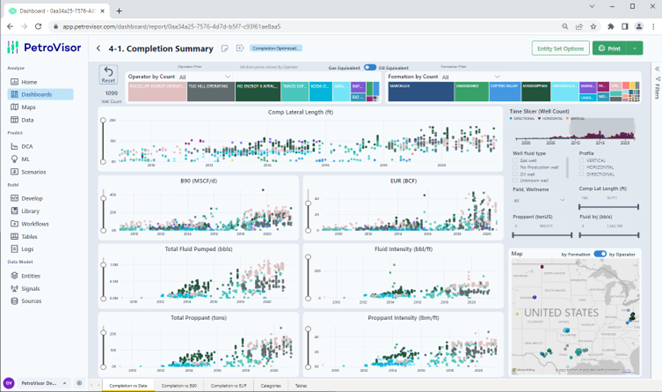
3. Choose Training Dataset
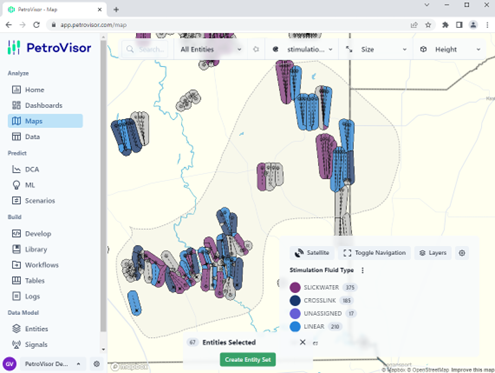
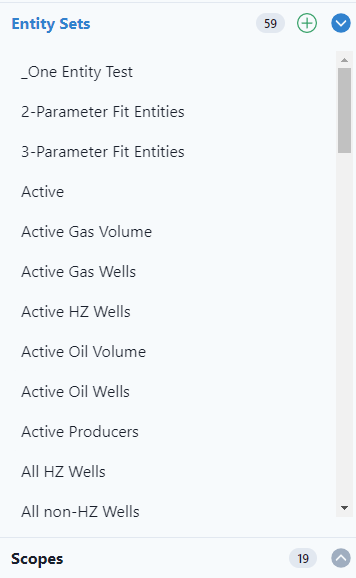
The user selects a set of wells (entity set) to train a Machine Learning (ML) model and generate a time-normalized average monthly production type curve. Using interactive dashboards and maps, the user can conduct a visual QC of the data during the selection process. Part of the selection process is to choose the relevant training parameters.
Client input:
- Entity Set
Considerations when choosing the Entity Set:
- Single Formation
- Hz. wells
- Single frac fluid?
- Single completion technology?
- Gas vs oil wells
- Parent/child considerations
- Geographic extent
- Completion Summary
- Production Summary
- Maps
4. Generate a Production Type Curve
The training data entity set is used to construct a 40-year, time-normalized (zero-time) average monthly production rate type curve. This curve is then later adjusted for individual completion designs in the optimization workflows.
The Type Curve is generated via an automated workflow.
Client input:
- Entity Set

5. Train ML Models
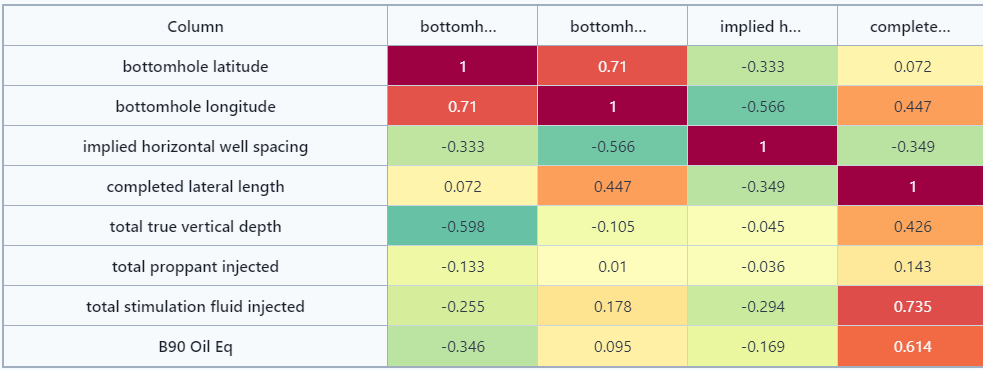
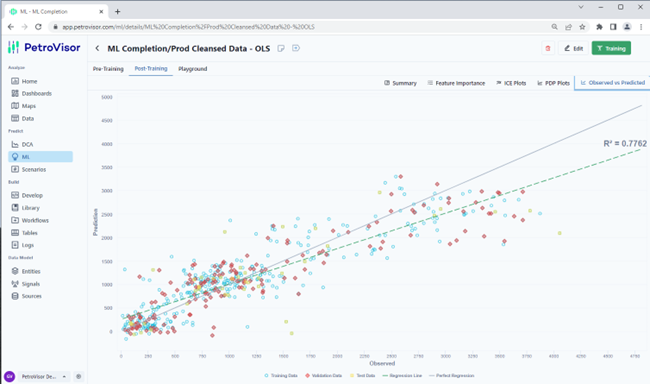
The ML model is intended to predict a prodcution KPI from completion, geo, and well spacing inputs. The ML module provides interactive screens to quickly choose the training variables and training settings.
The PetroVisor ML model setup and training screens include default settings that embed a significant amount of petroleum and ML domain expertise. Those default settings can be changed by the user which may be of interest as the user becomes more advanced in their understanding of the ML processes and ML model use in the Completion Optimization workflow. There are a variety of ML models that can be trained and tested during this step and PetroVisor can automatically select the best model.
Client inputs:
For the Production Prediction ML model:- Select input parameters and response variable (variable to predict)
- ML model prep:
- Choose model types
 Name Model
- Set several model parameters (defaults provided)
- Predict a Production KPI from:
- Completion data
- Geo data
- Parent/child data
- The time-normalized production type curve is adjusted for the completion, geo, and parent/child data
- ML models
6. Calibrate Economic Models
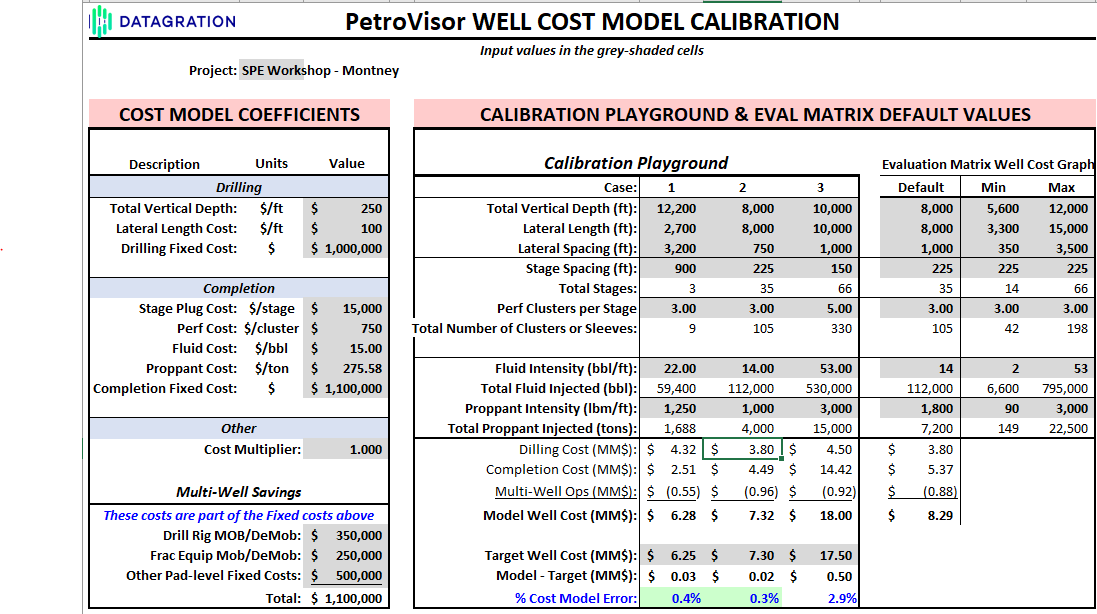
Calibrate two economic models: Well Cost and Economic Inputs. The Well Cost model generates wells costs based on completion, well spacing and TVD inputs. The Economic Inputs model accounts for operating costs, royalties, gas plant parameters, and commodity price adjustments
Well Cost Model
- The cost model generates a well cost from several cost components. Each component has a coefficient set by the user. The components:
- Total Vertical Depth ($/ft)
- Lateral Length ($/ft)
- Drilling Fixed ($)
- Stage Plug ($/stage)
- Perf Cluster ($/cluster)
- Fracture Fluid ($/bbl)
- Proppant ($/ton)
- Completion Fixed ($)
- Choose three (3) completion designs for calibration where the user inputs both the design parameters and the known/estimated cost.
- Vary the component cost coefficients until the cost predicted for the model matches the three calibration design cases.
Other Economic Inputs
- The other economic inputs are those items routinely required to run typical oilfield monthly cash flow analysis. There are quite a few inputs that relate to:
- Operating expenses
- Abandonemnt costs
- Royalties
- Gas plant yields
- Commodity prices, fees, and offsets
- The calibration process involves:
- Adjusting fixed and variable operating costs to match a target $/BOE or $/Mscfe.
- Choosing one of three Gas Plant/NGL yield models (simple, yield-matching, based on gas analsyis) and plant types (Dry gas, Dew Point, Shallow Cut, Deep Cut, Custom) to match observed NGL yields.

7. Evaluation Matrix
The Evaluation Matrix is a set of potential completion designs covering a range of completion, well spacing, and geologic parameters and values. The user assigns each parameter one or more values and the matrix consists of all possible combinations of values. Each case in the matrix generates a well cost, production forecast, a 40-year monthly cash flow stream, and several economic KPI's (NPV, ROR, etc.). The results of the Evaluation Matrix workflow are used to populate the Completion Optimization dashboard.
The Evaluation Matrix often contains several thousand potential completion designs.
Client inputs
- Well Cost model
- Other Economic inputs
- Commodity Prices
- Completion, well spacing, and geologic parameters and evaluation values
The PetroVisor Workflow will calculate for each case in the Evaluation Matrix:
- Well cost

- 40-yr Monthly production type curve
- 40-yr monthly cash flow
- B90 (~IP90), EUR, NPV, ROR, Payout, Well Life
8. Visualize / Decide
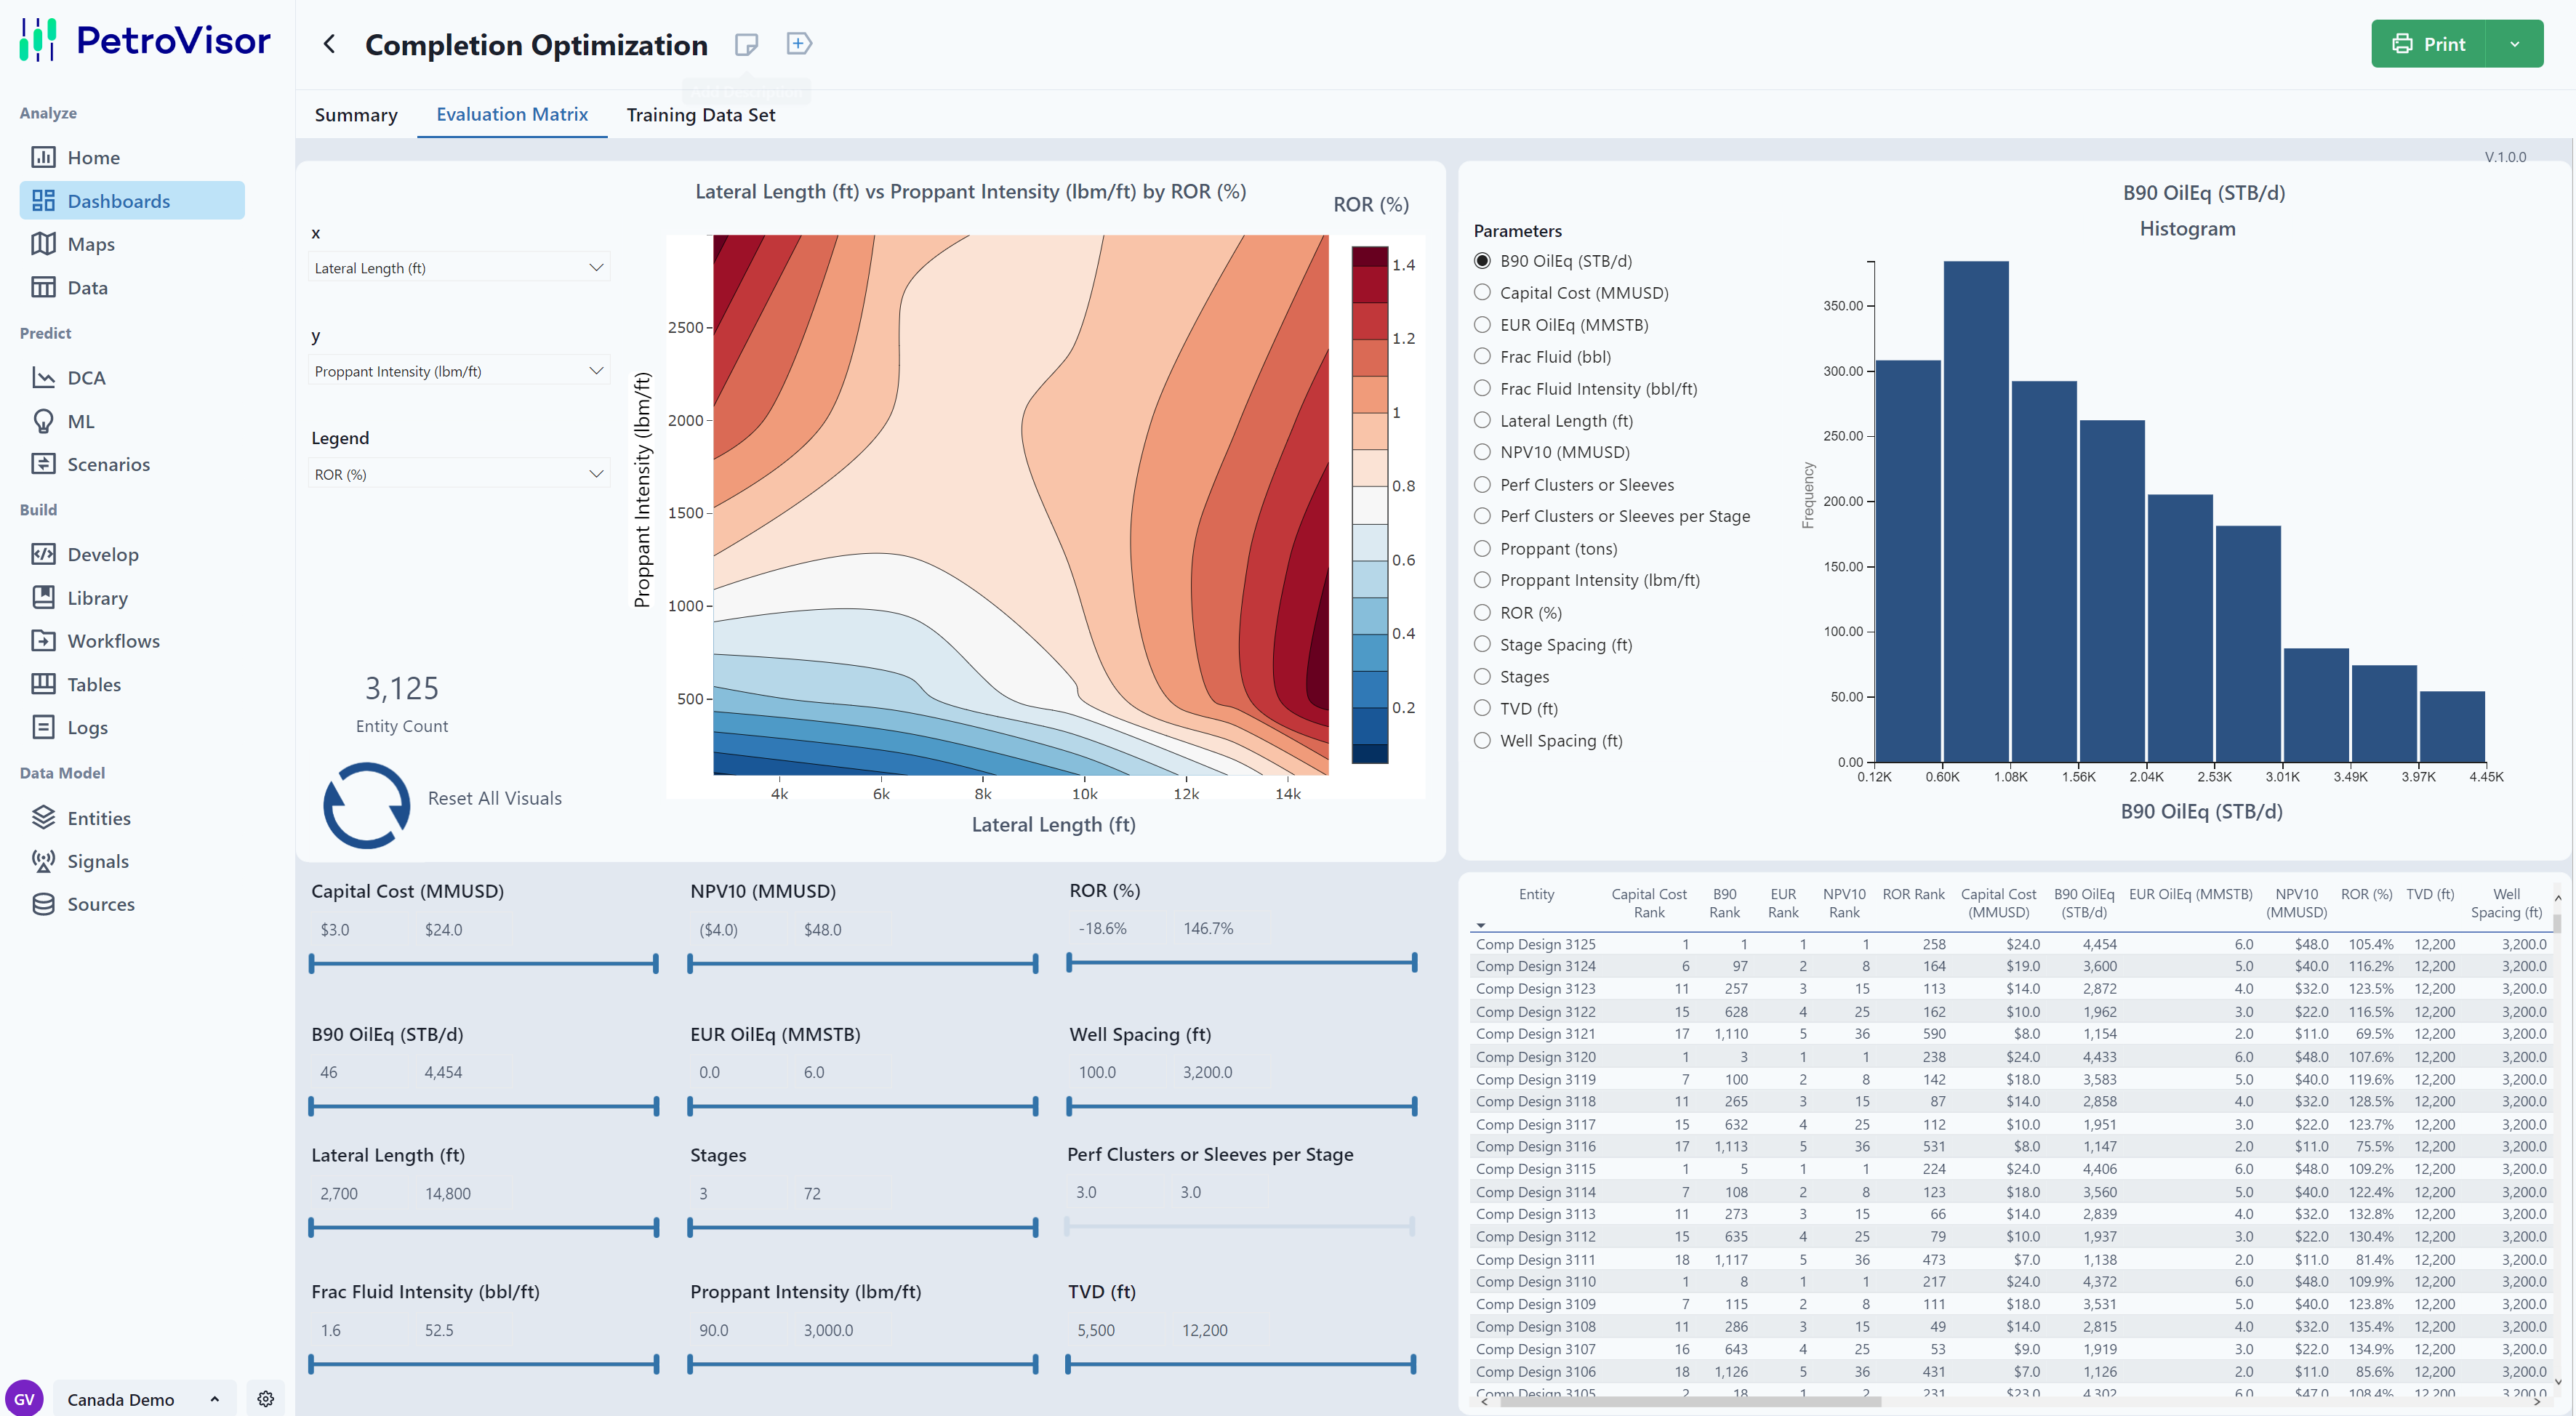
In the final step of Completion Optimization, the user views the results of the Evaluation Matrix with an interactive dashboard to understand optimal and near-optimal completion designs as functions of the completion, well spacing and geologic parameters. The near-optimal designs are often useful to understand the trade-off between operation risk (from very aggressive designs) and value.
From this analysis, the client can develop both near-term and long-term completion strategies.
Dashboard interactions:
- Choose x/y axis variables and colorfill variable to understand optimal and near-optimal designs as a function of completion, well spacing, and geologic parameters.
- View histograms of specific parameters (inputs or results) to visually understand the range and distribution of values.
- Use slider bars to restrict ranges of inputs or results.
- Use tables to understand specific parameters for top designs.
Considerations during the optimization:
- What are you optimizing/maximizing?
- Understand both optimal and near-optimal designs
- Define completion strategy & tactics
- Multi-year strategy
- What to do this year
- Lookback evaluations:
- Reality vs expectations
- Both well performance and well costs
- Individual wells and groups of wells
PetroVisor workflows populate the dashboard.
Dashboard:
- Completion Optimization (Summary tab)
- Completion Optimization (Training Data Set tab)

