An important step in Completion Optimization is selecting the appropriate entity set to train models.
This article walks through how to choose and create an entity set used to generate a time-normalized production type curve and train ML predictive models for Completion Optimization. The process of creating an entity set will utilize Maps, the Completion Summary dashboard, and the Production Summary dashboard to ensure the dataset is a good analogy to the area in which completions are to be optimized and to QC the dataset. The visualization tools in Maps and the dashboards will also determine the variables available for training, provide a qualitative understanding of correlations between variables, and indicate the size of the dataset. The examples throughout this workflow will use an 1,126-well dataset of the Upper Montney formation in British Columbia, Canada.
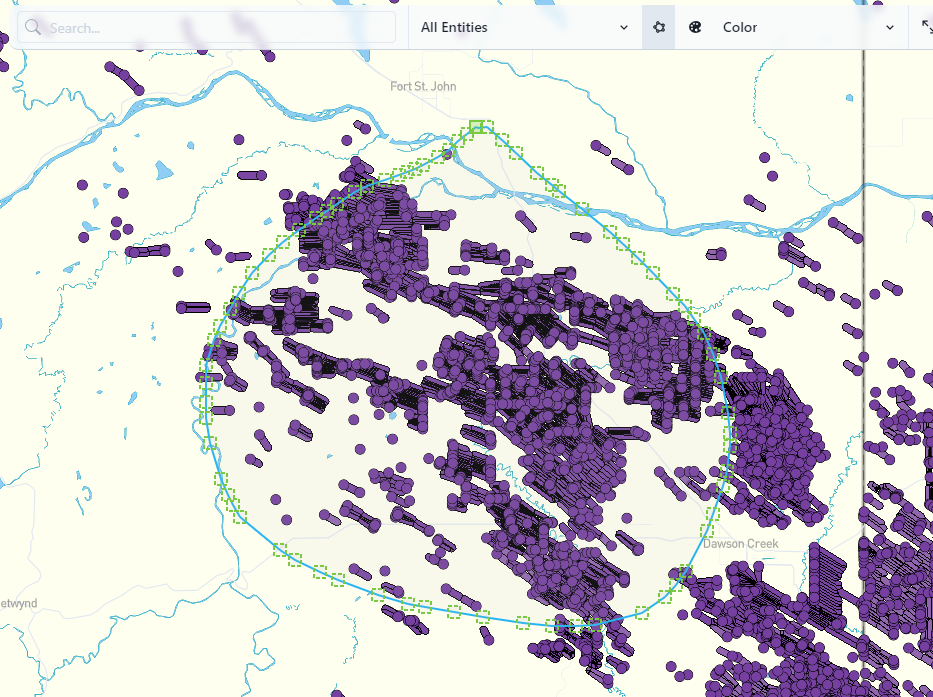
In Entity Set creation, there are both static and dynamic entity sets. A static entity set is a list of wells that does not change unless you manually update the entity set. A dynamic entity set is a well list created by rules or filters and the well list can change as the data in PetroVisor changes through additions, edits, or deletions. To make a static entity set, you can use the map lasso tool, and/or the Create an Entity Set function in the Completion Summary or Production Summary dashboards.
In Maps, after pressing the Lasso button, then click and hold the left mouse button, creating a closed polygon around the wells of interest. Upon releasing the left mouse button, a popup window will appear at the bottom of the screen with a button to Create and Entity Set. Select that button and another popup window will appear asking for an Entity Set Name with a list of wells and well count. You can save to an existing Entity Set name or a new name.
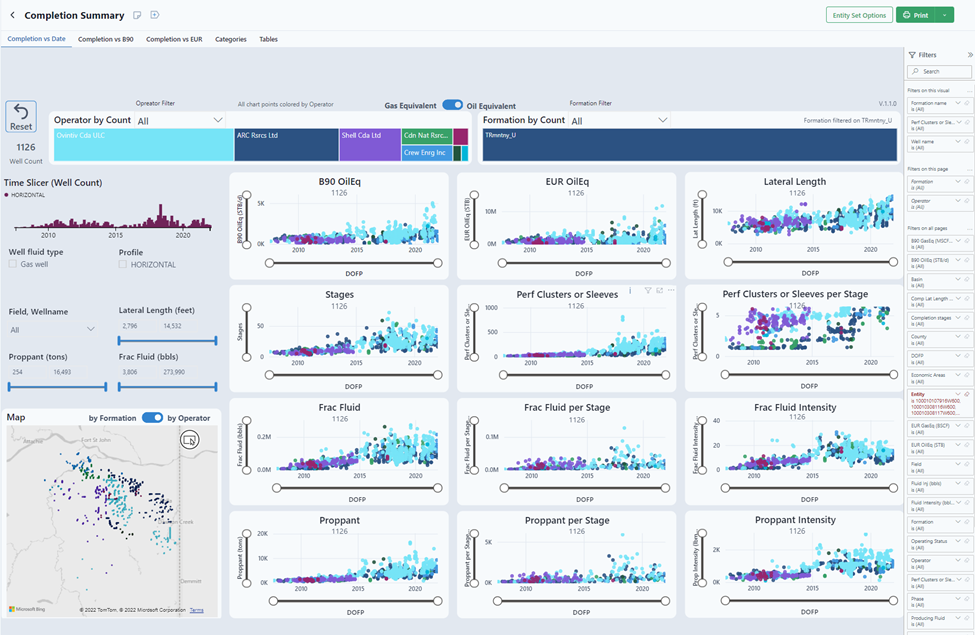
In the dashboards, existing entity sets can be selected to view data and new entity sets can be created. Use the filters on the right margin to filter down to the wells of interest. Outliers and incomplete datasets are often excluded through filtering during this process. When finished, select the Entity Set Options to save to an existing or new entity set name. A typical workspace may have dozens of entity sets for a variety of purposes, therefore choose a name that is easily distinguished from other entity sets.
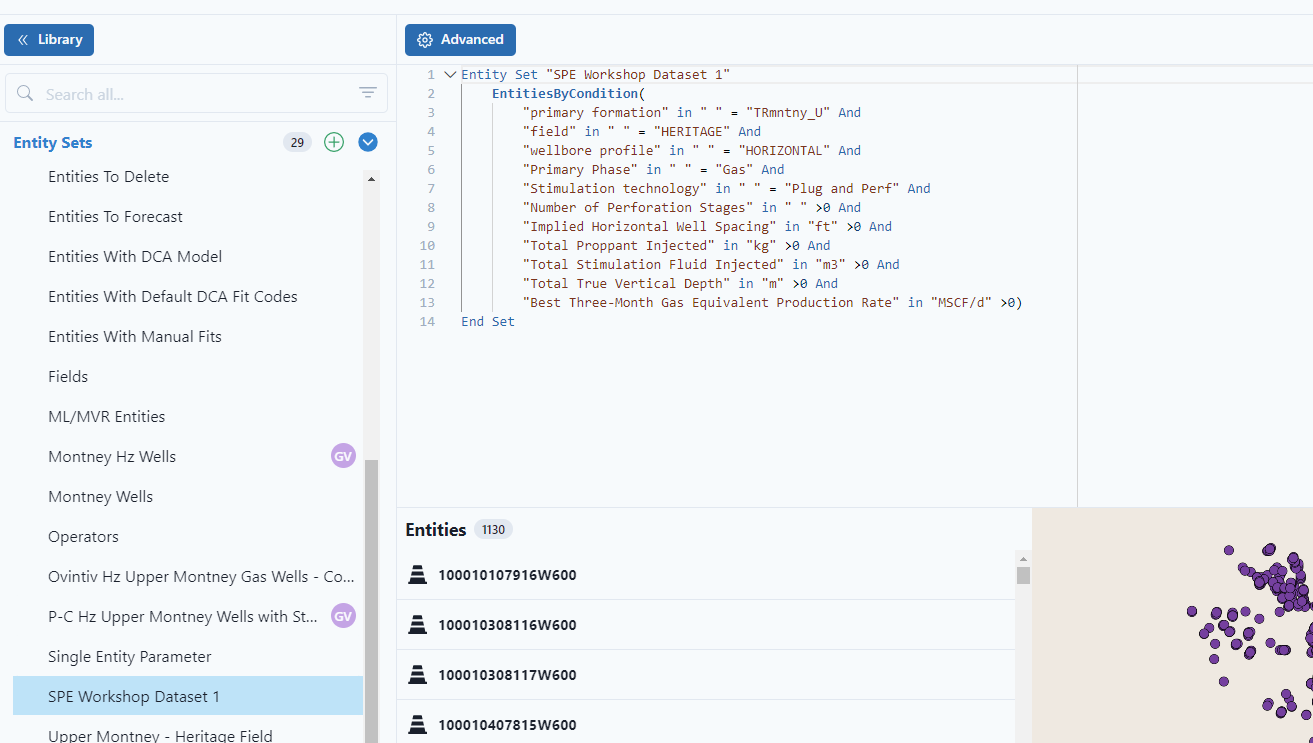
A dynamic entity set is created in Library using P# scripting, example below. The recommendation is to use EntitybyCondition to create the entity set. Usually, you will recreate the filters you would impose when creating a static entity set. Once saved, this entity set will regenerate the well list from the rules embedded in the EntitybyCondition P# script each time the entity set is used.
Entity Set Selection Map-based Example
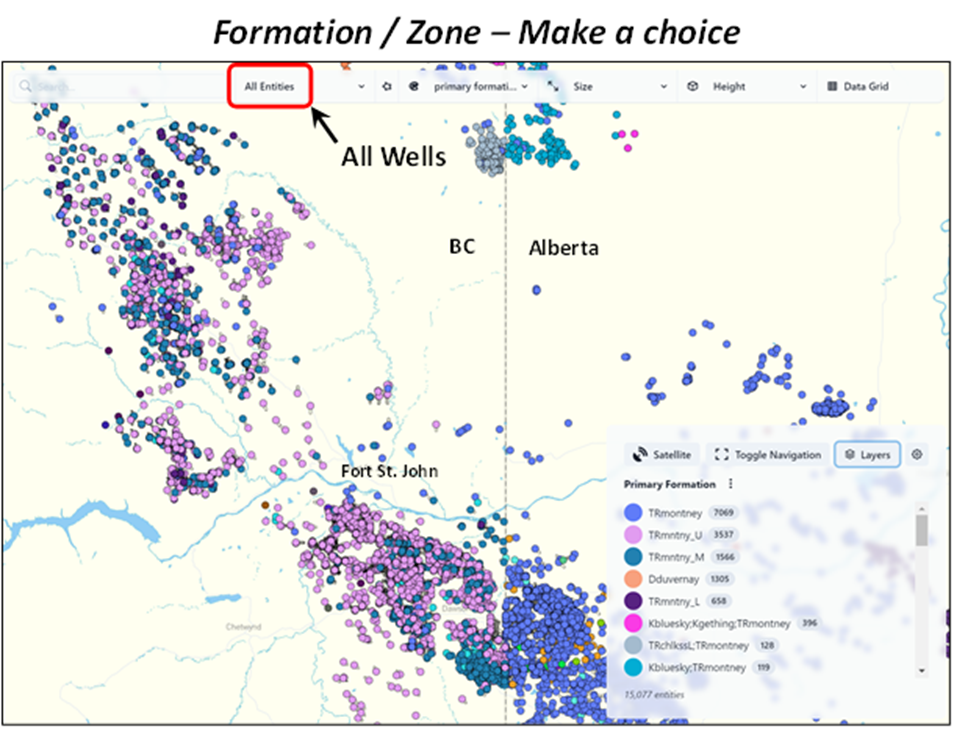
It is easier to trim down large datasets than expand small datasets. A good place to start is in Maps, where all the wells in the workspace are available for viewing and selecting a geographic area of interest. The map below presents all the Montney and Duvernay wells in Western Canada. Usually there will be an area of interest for the Completion Optimization results to be applied, that pre-determines the general geographic area and formation/zone for the training dataset.
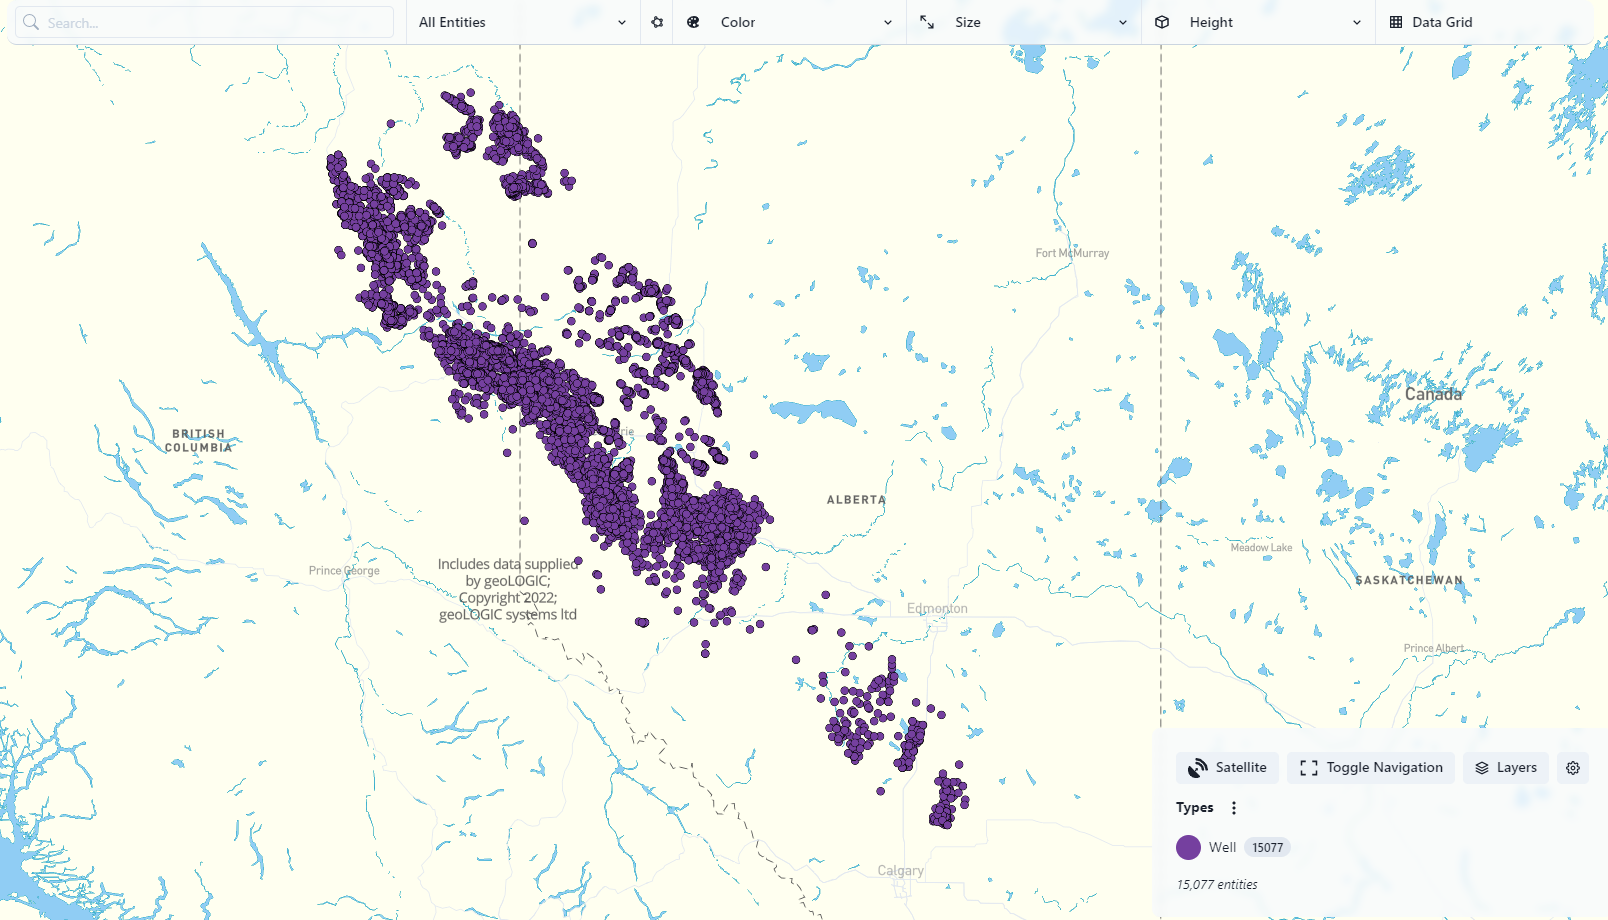
When selecting an entity set for Completion Optimization, the user generally strives to include as many data points as possible, while simultaneously limiting the geographic area and formation property variations. This leads to two drivers that are in conflict with each other. By viewing the data in Maps, the user can quickly understand the available data, well productivity, and geologic parameters over various larger or smaller geographic areas. It is a personal choice as to the final training dataset, and often several larger or smaller datasets are chosen for evaluation.
Rule of Thumb: 10 wells with complete data per input for evaluation. If the user wants to evaluate 10 inputs, there should be at least 100 wells.
When selecting the wells, the user should have some knowledge of the formation and completion practices. The Montney Formation is very thick and is a multi-zone development. In this example we chose to focus on the Upper Montney after viewing the available zones in the area of interest (Eastern British Columbia). This was accomplished by color-coding by Formation in Maps and noticing there were numerous Upper Montney wells in the area of interest (pink dots in map just below).
To further narrow the dataset, color-code by Field and notice the Heritage field provides good coverage of the Area of Interest (pink dots on map below).
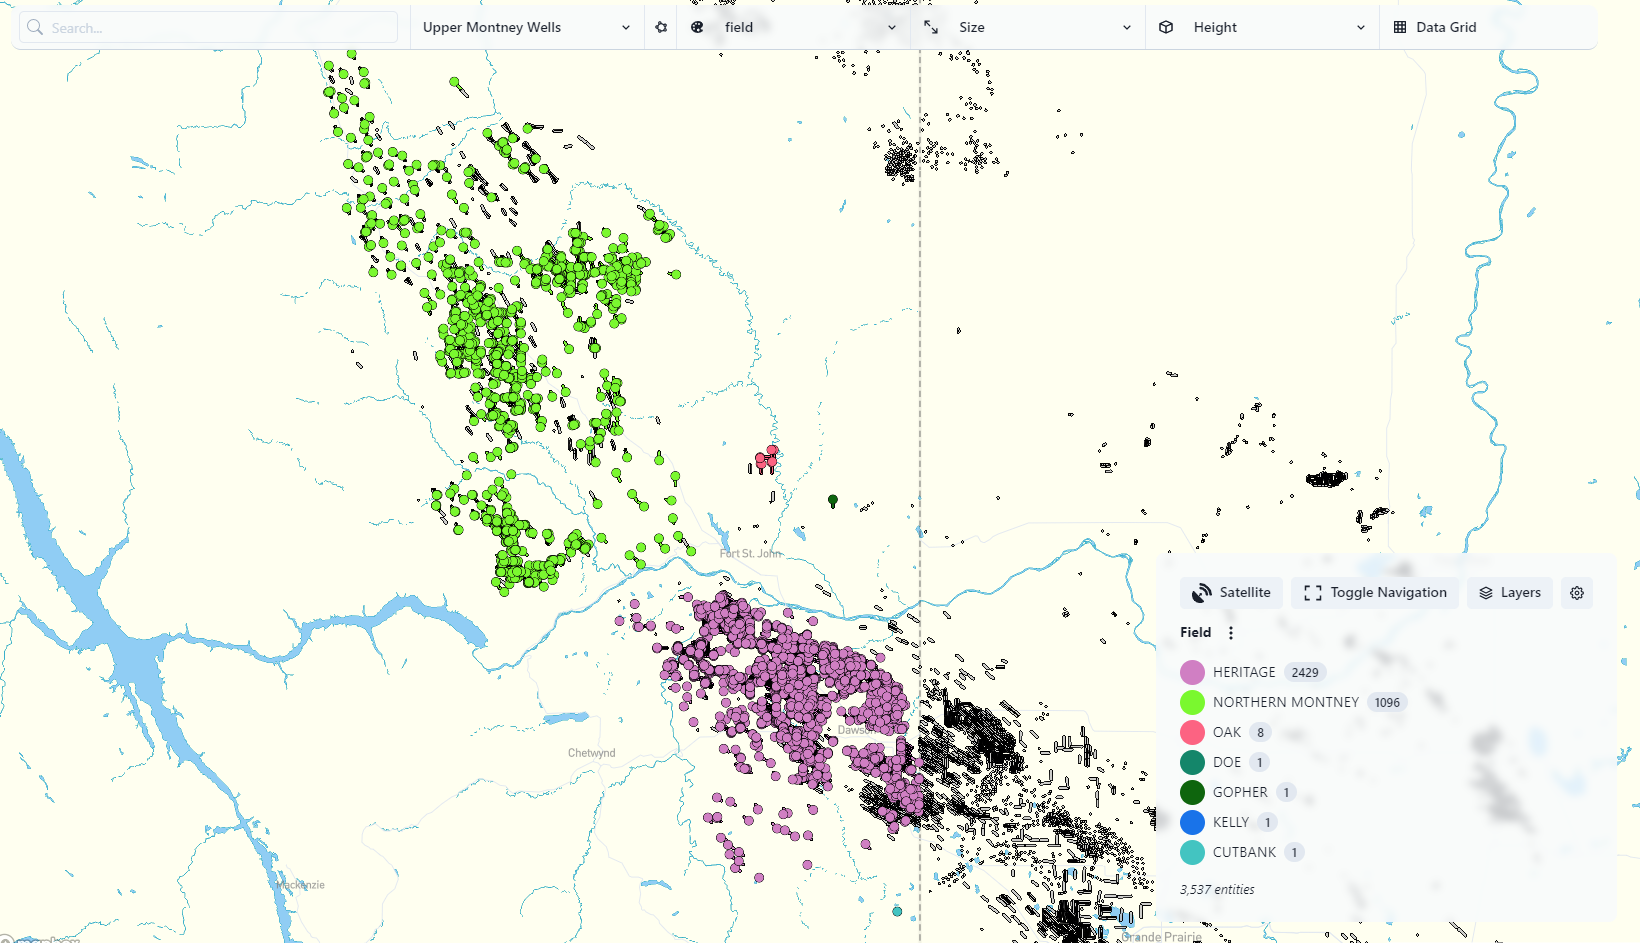
Notice in the map above the previously created Upper Montney Wells Entity Set had been imposed and the wells colored by Field. At this point, an Upper Montney, Heritage Field entity set can be created using the Lasso tool with map above, circling the Heritage Field wells, or via using filters in a dashboard, or by writing an EntitiesbyCondition script..
Once the Upper Montney Heritage Field Entity Set is created, choose that entity set in Maps to further QC and understand the dataset.
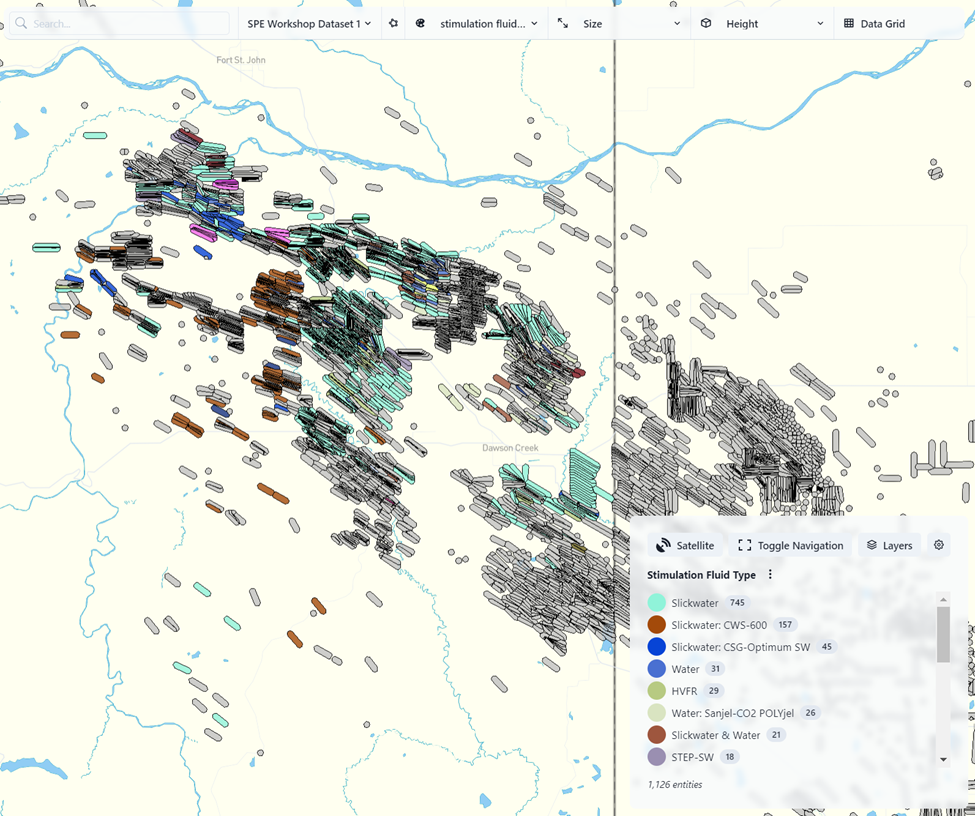
For instance, a potential next refinement would be to start looking for different Stimulation technologies. Ideally a dataset will only include one technology to provide a more apples-to-apples comparison. In the map below the green colors indicate Plug & Perf completion technology and was chosen to further define the training dataset.
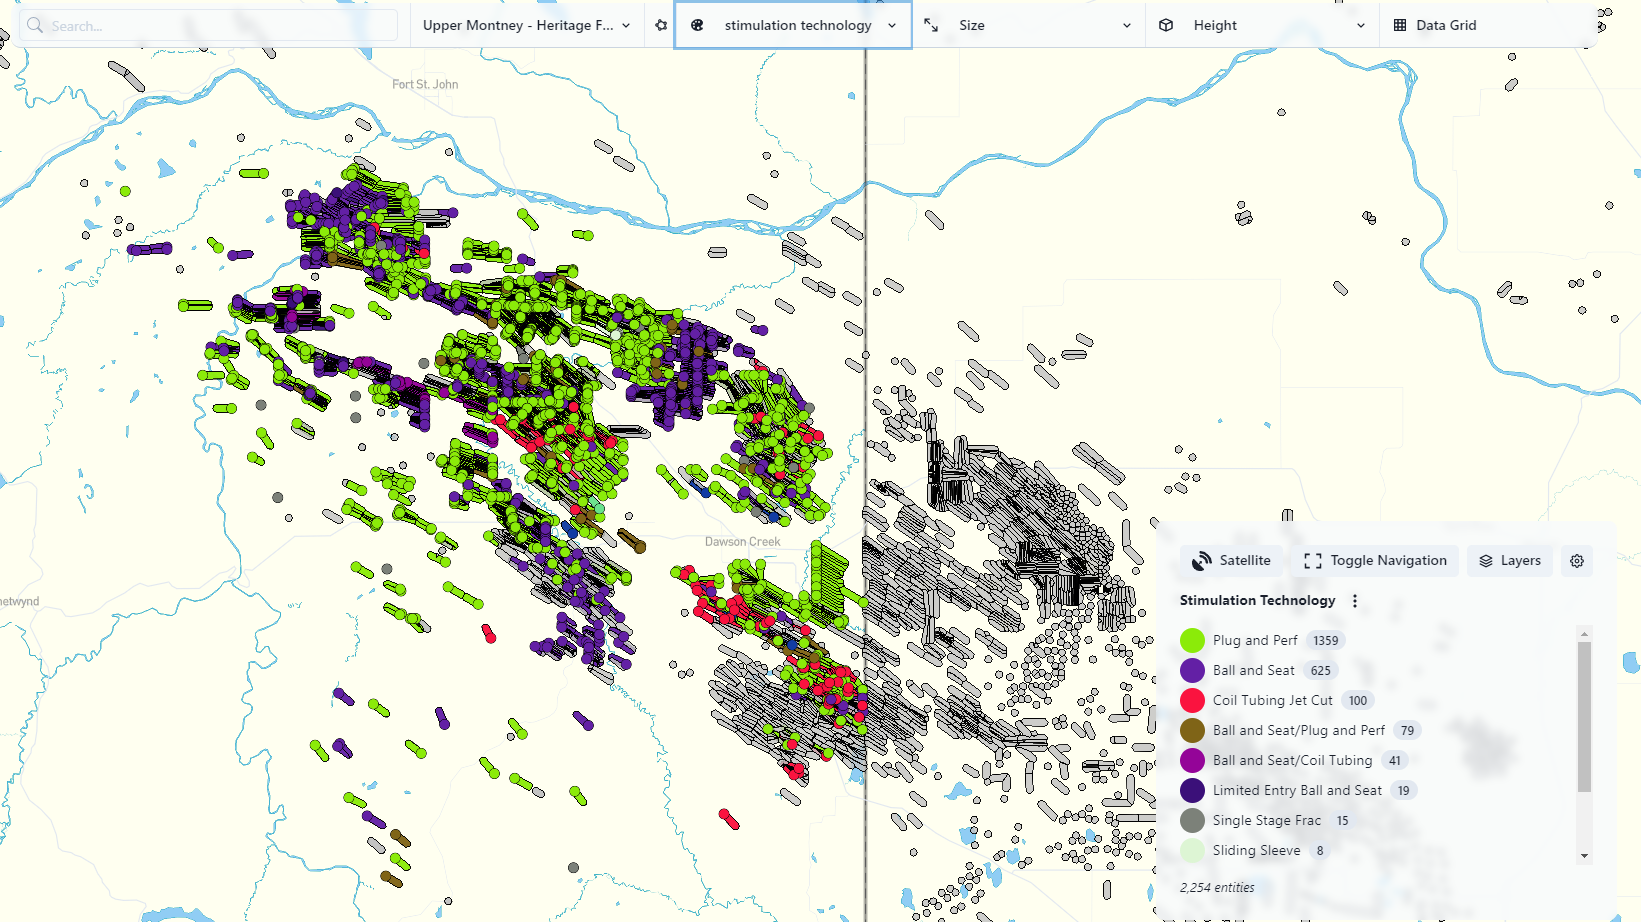
The next step would be to determine if there is enough information in a specific technology to run the optimization workflow. Notice in the legend, the well count associated with each technology is easy to determine because it's listed in the gray circle next to each item.
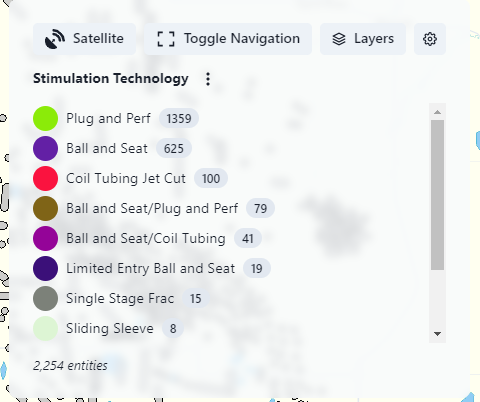
There is enough data in the Plug and Perf technology to run the Completion Optimization Workflow because there are over 1,000 wells. Further datasets for each completion technology could be evaluated with their own training datasets. The workflow would be the same, but the entity sets would be different. Additional refinements include choosing a single reservoir fluid type (gas wells) and possibly a single stimulation fluid (slickwater, map below.)
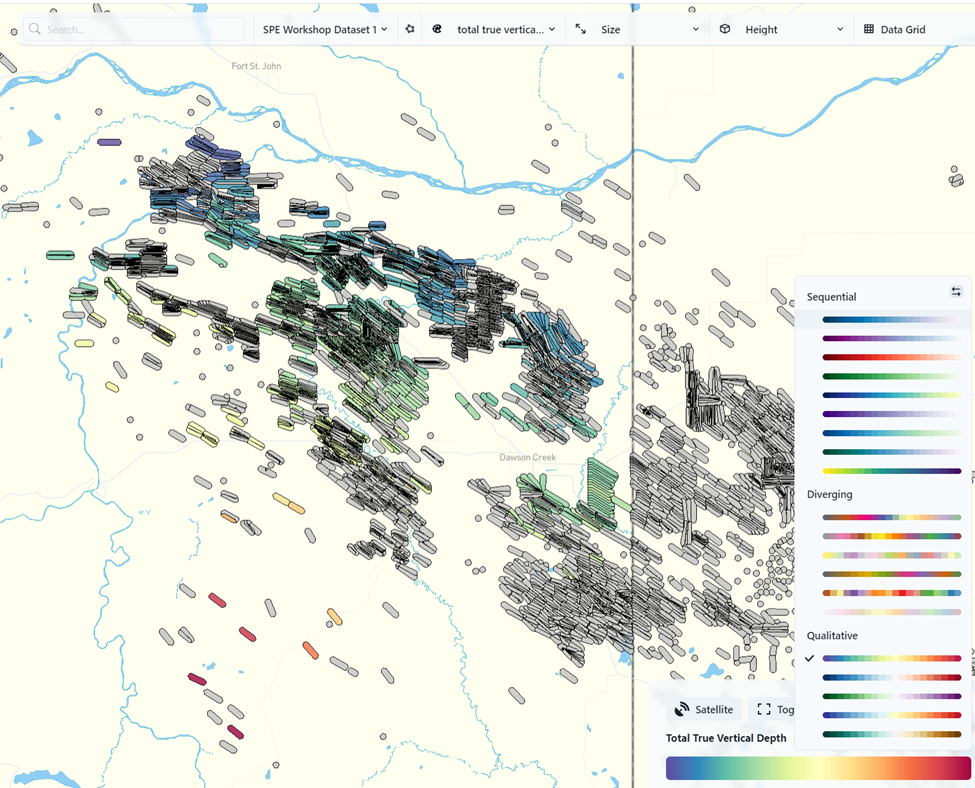
The next step is to look for outliers or incorrect data. Using Maps is a good tool for QC’ing TVD data sets. Using the now-refined entity set forUpper Montney, Heritage Field, Plug and Perf, color-fill the map by TVD choosing a useful color spectrum. Visually look for TVD’s that are obviously out of place based on color. None appear on the map below, thus consider TVD curated for this dataset.
Entity Set Selection - Dashboard Refinement
In order to further QC and understand the Entity Set, go to the Completion Summary Dashboard and the Production Summary Dashboard in the Dashboards tab.
Completion Summary
To view the selected Entity Set from the map, click "Entity Set Options" and filter to the correct Entity Set. Start with the larger entity set to ensure to start looking for outliers and some potential quality control issues.
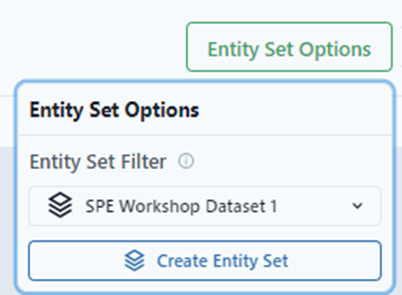
Once the entity set is chosen, the dashboard will filter to that set of wells for all the dashboard tabs.
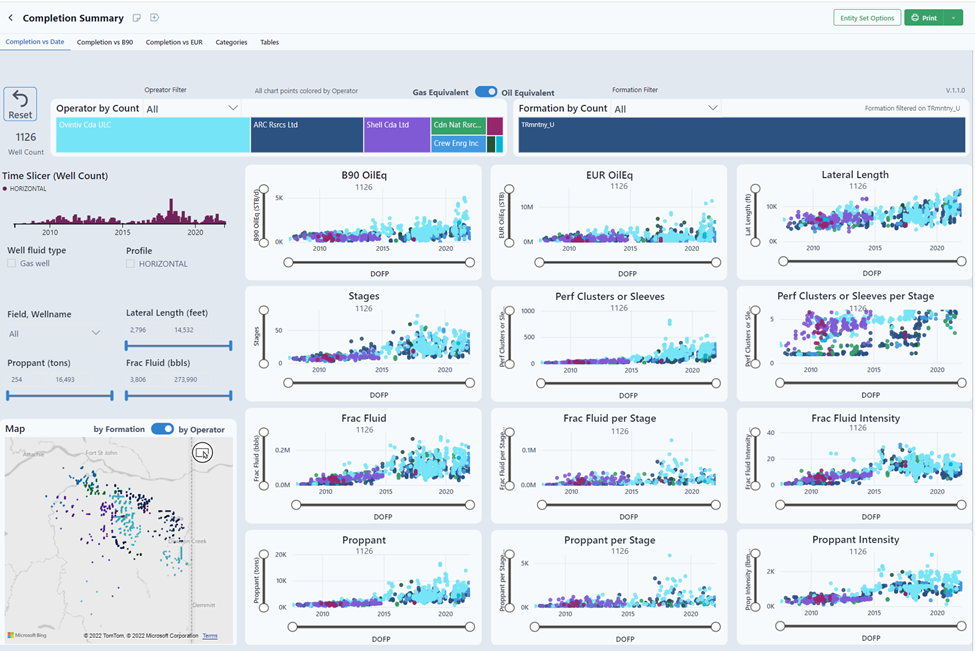
The various graphs in each of the tabs can be used to QC the completion data and provide early insights in correlations between variables. To QC the data, look for obvious outliers. No extreme outliers appear in the dataset. If they did, the user can locate and fix the incorrect data, eliminate using additional filters, or impose outlier detection and removal in the model pre-conditioning phase.
Notice the number 1126 under the title in the graph below. It indicates the number of wells with data in that graph. The graph is color-coded by operator.

The numerous filters on the right margin of the dashboard can be used to further refine the dataset as needed. If refinements are made, the well list can be saved as a static entity set from the dashboard.

To create a dynamic entity set, under Library, create the Entity Set by condition. An example is below, defining the “SPE Workshop Dataset 1” entity set.
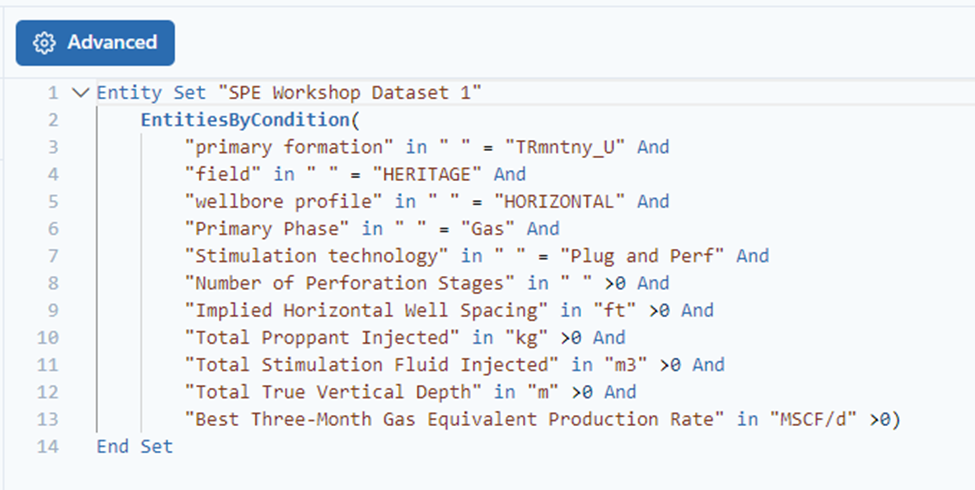
A rule of thumb while creating the entity set it to make the condition greater than 0. This rule ensures there is data for each condition.
Production Summary
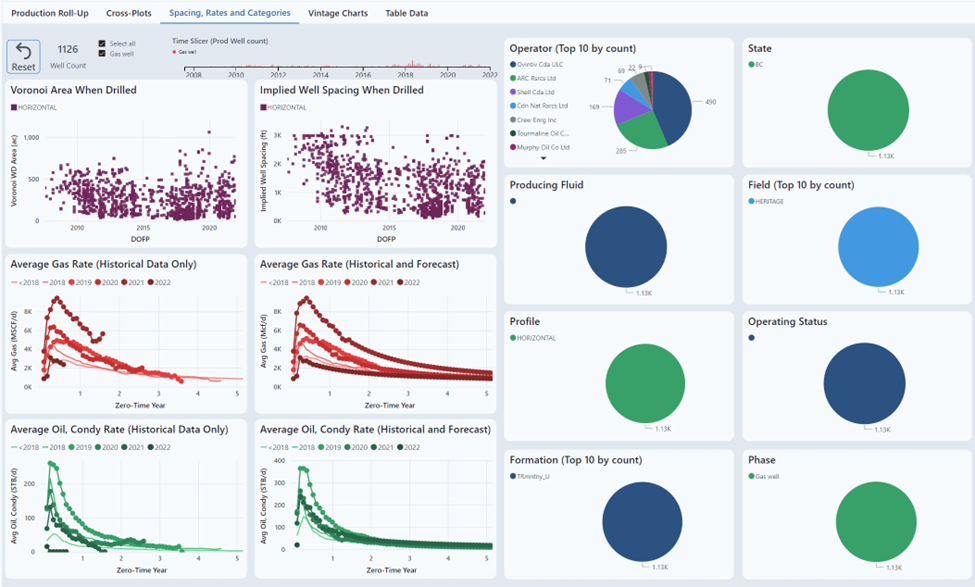
The Production Summary dashboard can further refine the data set and provides a look at potential production type curves. It shows data that is not available in the Completion Summary dashboard such as well spacing and potential drainage areas (Voronoi areas).
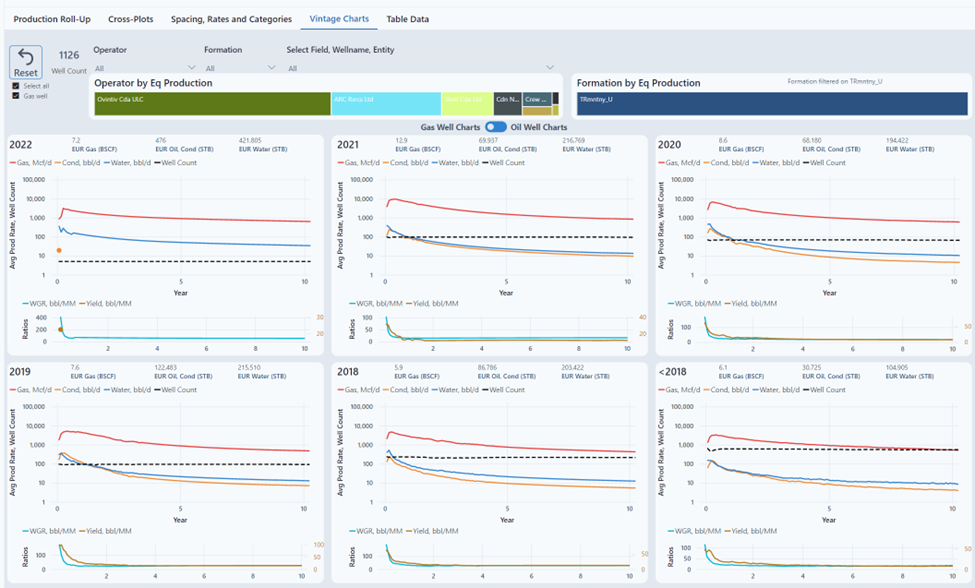
The dashboard includes zero-time average production plots by vintage as shown in the next two graphics below. A zero-time average production plot built from the training dataset wells scaled to specific completions will form the basis for the production forecasts in the Evaluation Matrix.
Confirm Data in the Data Section
To view individual well data from the Entity Set in it's entirety, view the data selection in the Data section. Select the Entity Set and the signals from the conditions used to create the entity set.
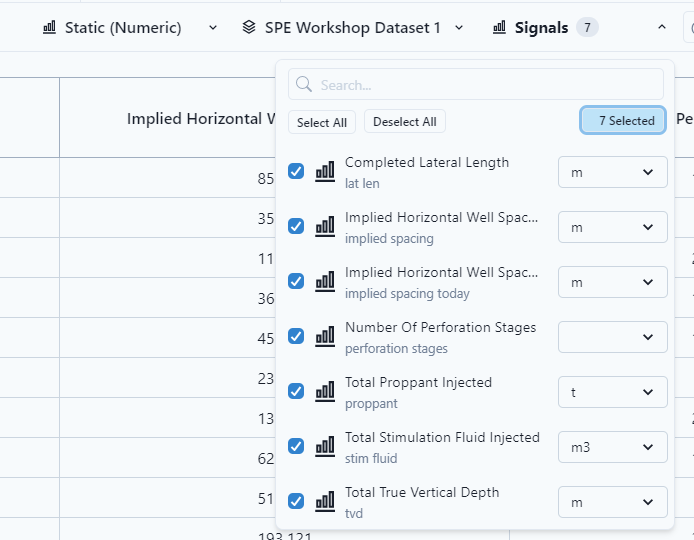
The table is easy to scroll through and verify if data is missing.
After the Entity Set selection, the next step is to build a production type curve.
