Import data into PetroVisor relevent to the Completion Optimization workflows. Map source data to PetroVisor signals, load, and QC the data.
1. Data Load
The Data Load step consists of three sub-steps:
- Data Mapping
- Data Integration
- Data QC
The type of data needed for the Completion Optimization workflows include:
- Well Header (including latitude and longitude of at least surface and toe)
- Production
- Completion
- Geologic
During the initial implementation, Datagration will provide a list of desired data and ensure the data is loaded into the appropriate signals. The Well Header and Production data are usually automatically updated monthly while the completion and geologic data may be updated more sporadically.
Data Mapping
The data mapping is the process to associate column names in the data source with column names in the PetroVisor data structure. In PetroVisor these columns are called 'signals'. PetroVisor has an inventory of numerous pre-created signals to choose from and the ability to easily create new signals if needed. Once the mappings are created, they are saved for future use.

Data Integration
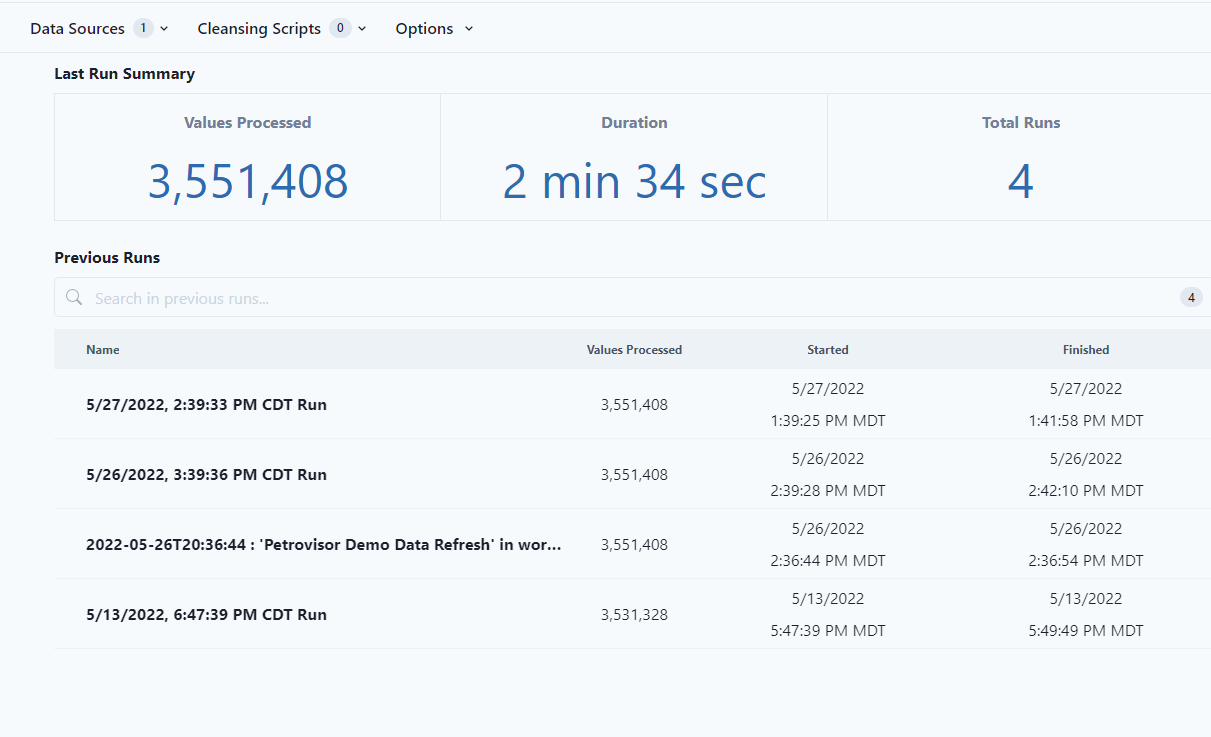
Once the mapping is complete, the data load is very easy using the Data Integration button. Summary stats of the data load allow the user to know if the data load was successful.
Data QC
After the data is loaded, the user QC's the data with the PetroVisor Data module to ensure the data in PetroVisor reflects the data in the source. Alternatively, the user can export the data from PetroVisor for and external comparison to the source data.


