The PetroVisor AL focuses on improving mechanical integrity and increasing production output for oil and gas operations.
The purpose of this Steward dashboard is to
- Compare the production vs. forecast
- Evaluate the underperformance of the wells
The Artificial Lift Dashboard consists of three (3) tabs
- Summary
- SRP (Sucker Rod Pump)
- ESP (Electric Submersible Pump)
Summary Tab
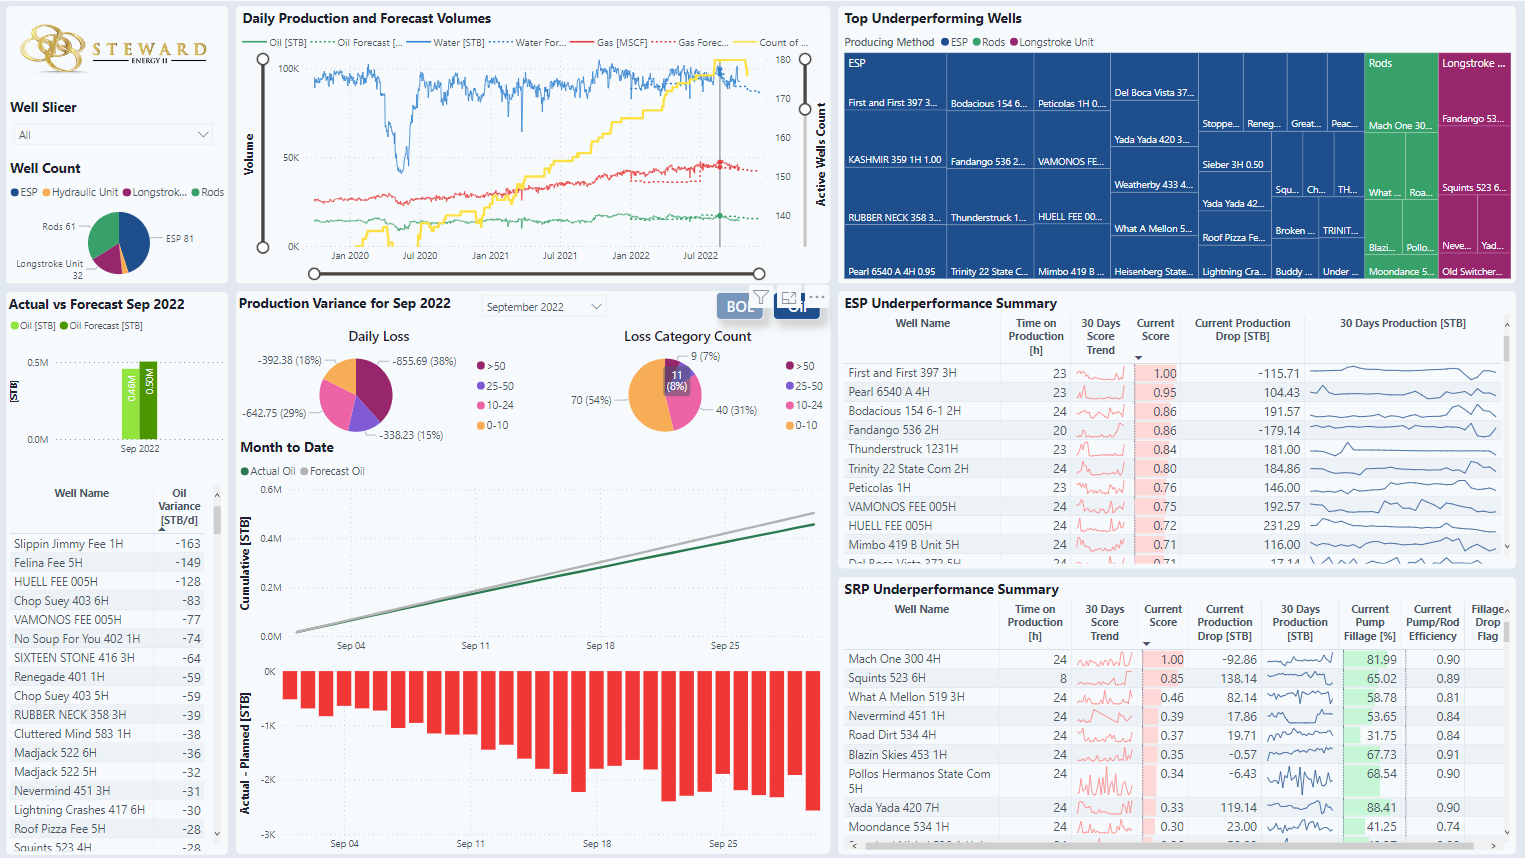
The Summary tab highlights underperforming wells. The wells displayed in this dashboard are only wells with artificial lift.
Filter
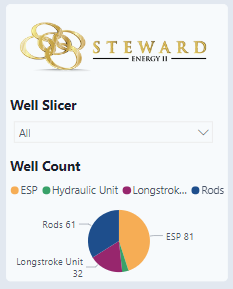
The dashboard has a well slicer and a well count. Wells can be selected from the Well Slicer drop-down menu or by selecting a well type in the pie chart. The lifting type comes from P2 and the signal in PetroVisor is Lift Type.
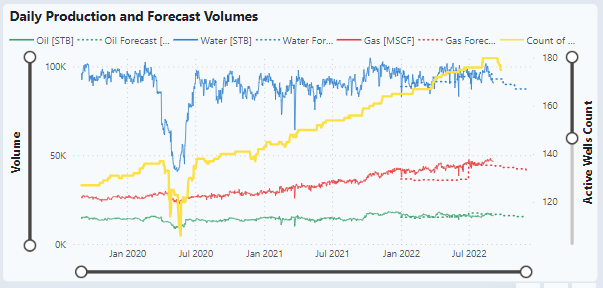
Daily Production and Forecast Volumes
This graph displays the oil, gas, and water production vs forecasts. The count of active wells are wells that had oil, water, or gas volumes reported in the last 20 days. The slicers on the sides of the graph will resize the display.
The forecast is the Steward projection.
Production Variance
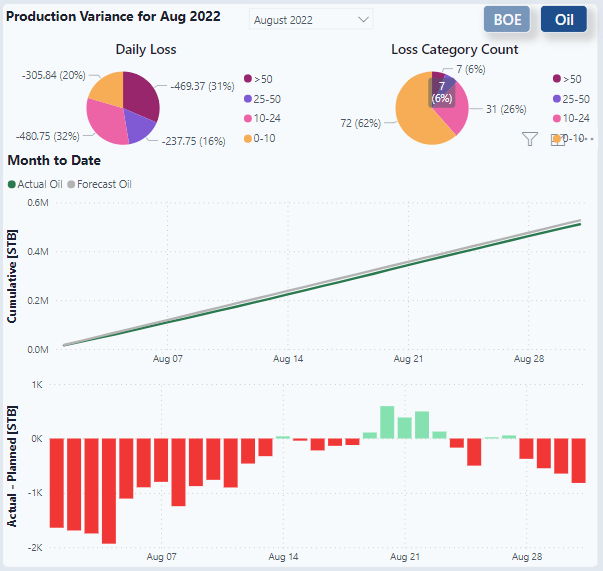
This chart displays the selected month data. From the drop-down menu, the month can be selected. The month will also change the chart and the table for Actual vs Forecast.
The production variance used in the pie charts is the difference between the total produced volumes and the forecast for the selected month, divided by the number of days in that month.
- The Daily Loss chart displays the sum of this production variance in bbl grouped by loss category in bbl/d.
- The Loss Category Count chart displays the number of wells in each loss category.
- The Cumulative chart shows the month-to-date oil volume of actual production and forecast.
- The Actual - Planned chart displays the daily variance of actual oil production vs forecast.
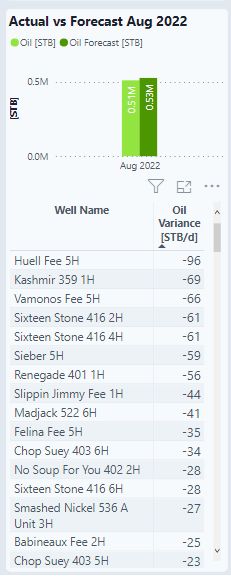
Actual vs Forecast
The chart displays the total oil volume produced vs forecast in the selected month. The table shows the average daily variance of produced oil vs forecast. The forecast monthly volume for each well is divided by the number of days in the month subtracted from the actual produced oil in each day to give a daily variance. The reported number in the table is the average of this daily variance in the selected month.
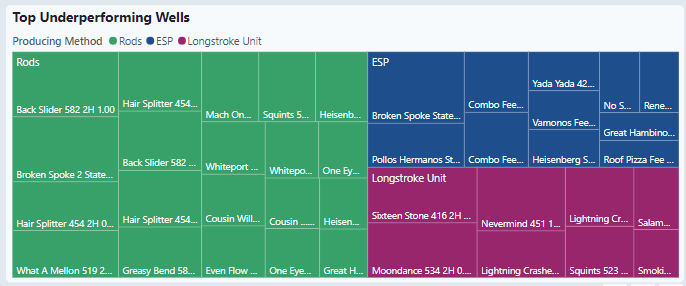
Top Underperforming wells
This tree map lists the top underperforming wells by producing method.
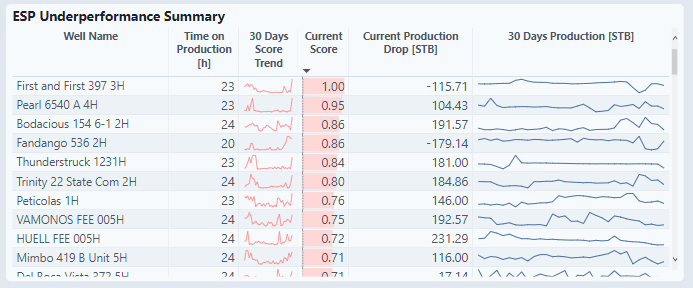
ESP Underperformance Summary
Lists the top ESP Underperforming wells with the following data:
- Time on production - last reported producing day
- 30-day score trend
- Current Score - From 0 to 1.
- 1 is rank #1 in underperformance
- 0 means no underperformance
- Current Production Drop - Liquid volume (Oil + water) drop in STB compared to last week's average
- 30 Days Production
ESP Underperformance Calculation
Underperformance score = 0.5 * (0.6 * oil rate drop + 0.4 * water rate drop) + 0.15 * head factor drop + 0.15 * system efficiency drop + 0.1 * pump intake pressure score + 0.1 * esp trip score- Drops in the underperformance ranking are calculated relative to last week's averages (fraction)
- Pump intake pressure score indicates if and how much the pump intake pressure trend was increasing during a production day
- ESP trip score indicates if and how often the ESP pump has tripped during a production day
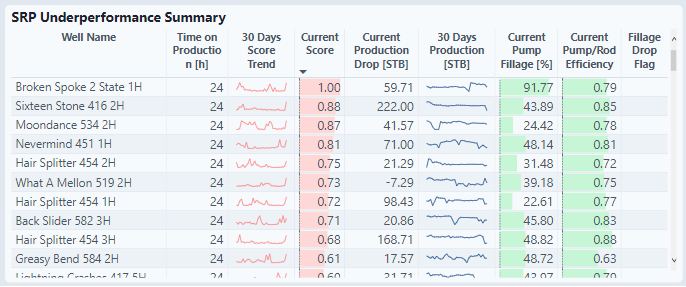
SRP Underperformance Summary
Lists the SRP Underperforming wells with the following data:
- Time on Production - last reported producing day
- 30 Days Score Trend
- Current Score-
- 1 is rank #1 in underperformance
- 0 means no underperformance
- Current Production Drop - Liquid volume (oil + water) drop in STB compared to last week's average
- 30 Days Production
- Current Pump Fillage
- Current Pump / Rod Efficiency - Last calculated value (hourly)
- Fillage Drop Flag
- Flag appears in the column if pump fillage drops to below 80% of last week's average (hourly values)
- Added to the table to indicate a significant change compared to normal or average values
SRP Underperformance Calculation
Underperformance score = 0.5 * (0.6 * oil rate drop + 0.4 * water rate drop) + 0.3 * pump fillage drop + 0.2 * pump-to-rod efficiency drop- Drops in the underperformance ranking are calculated relative to last week's averages (fraction)
SRP
Filter
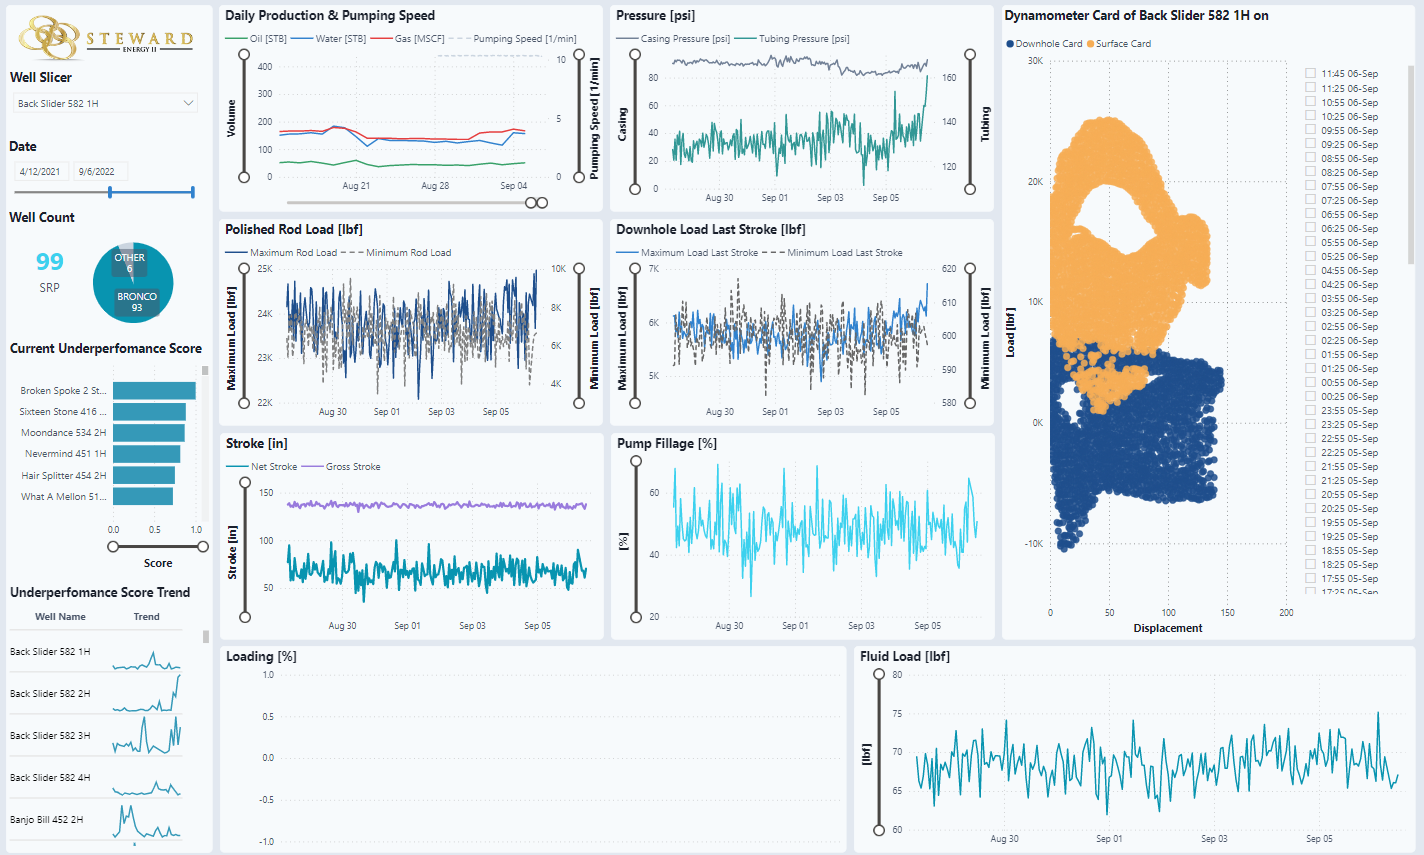
The dashboard has a well slicer and a well count. Wells can be selected from the Well Slicer drop-down menu. The Well Count divides wells by Bronco vs non-Bronco wells.
Under the filter is also a list of the current underperforming wells.

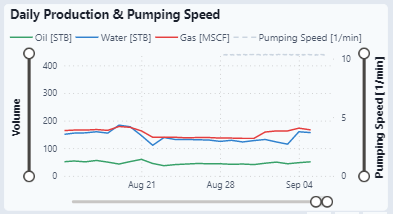
Daily Production & Pumping Speed
- Oil, water, gas volumes and pumping speed
- Hourly data for the past 10 days
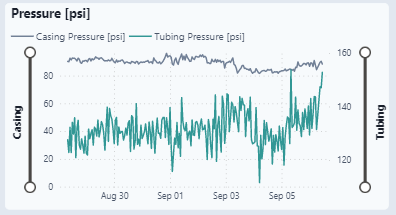
Pressure
- Casing pressure and tubing pressure
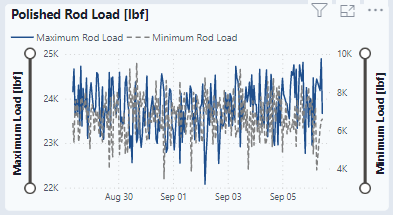
Polished Rod Load
- Maximum rod load, and minimum rod load
- Hourly data for the past 10 days
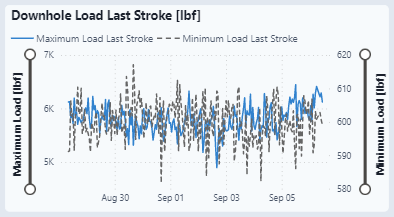
Downhole Load Last Stroke
- Maximum load last stroke and minimum load last stroke
- Hourly data for the past 10 days
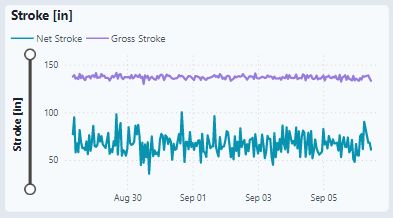
Stroke
- Gross stroke and net stroke
- Hourly data for the past 10 days
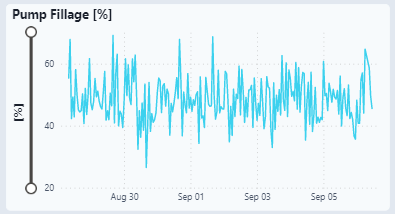
Pump Fillage
- Hourly data for the past 10 days
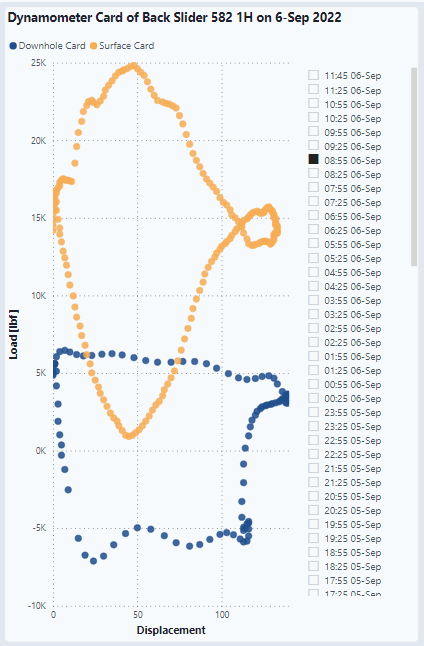
Dynamometer Card of Back Slider
A well must be selected in order to see the graph.
- Surface and downhole cards
- Every 30 minutes for the past 5 days
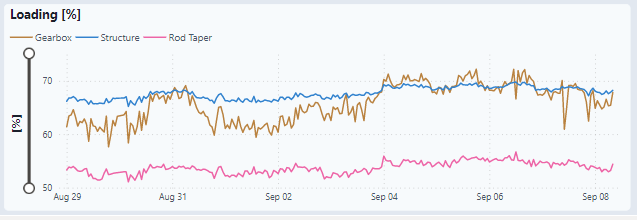
Loading
- Gearbox, structure, and rod taper loading
- Hourly data for the past 10 days
- Only appears when wells with specific feature are selected
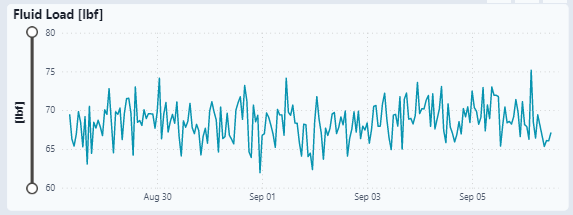
Fluid Load
- Hourly data for the past 10 days
ESP
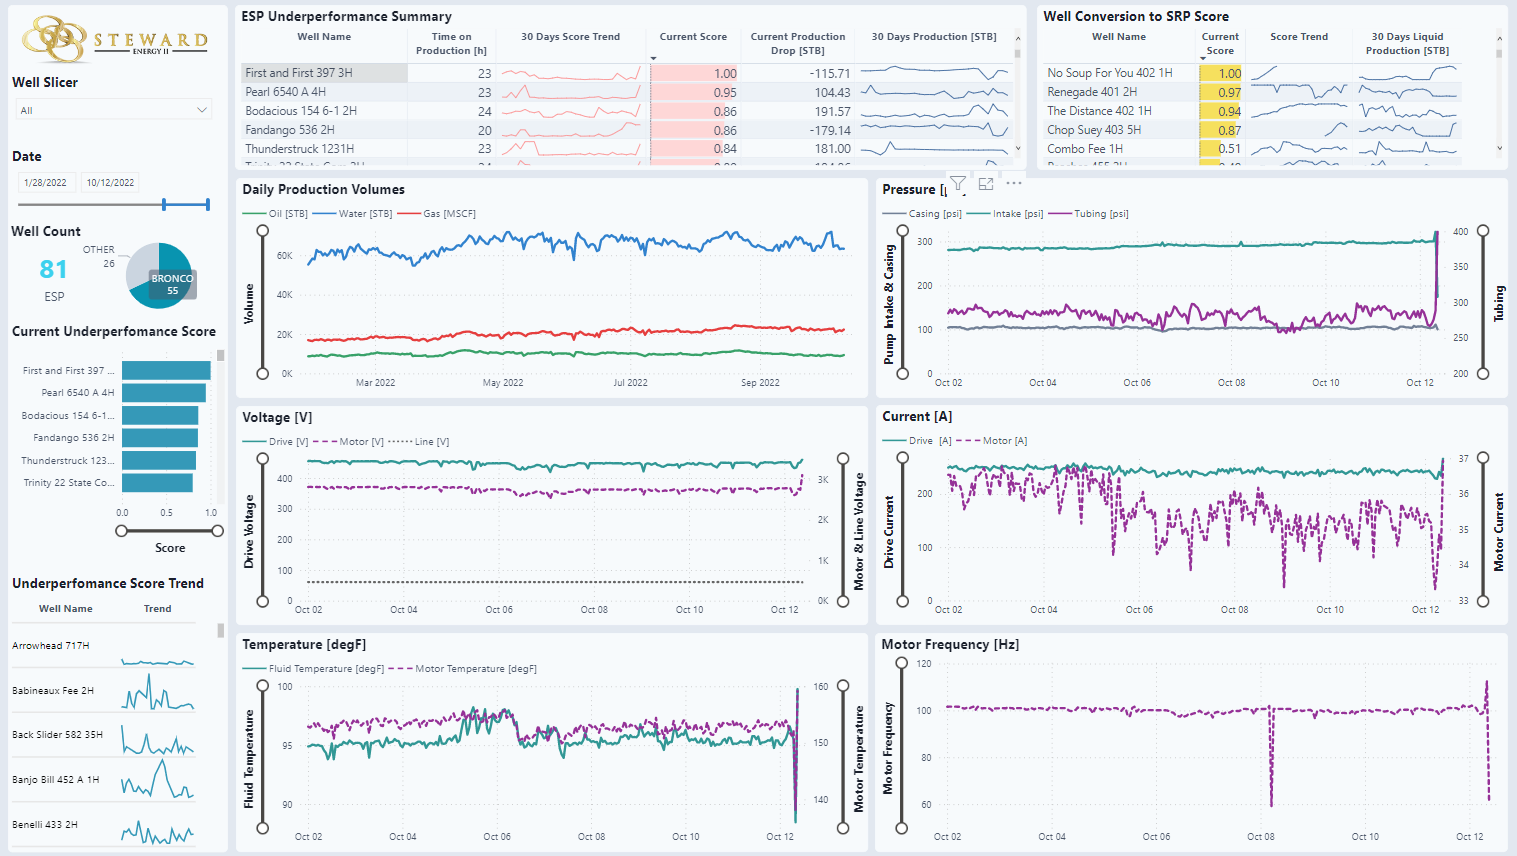
Filter
The dashboard has a well slicer and a well count. Wells can be selected from the Well Slicer drop-down menu. The Well Count divides wells by Bronco vs non-Bronco wells.
Under the filter is also a list of the current underperforming wells. It lists the current score as well as the trend over the past month.

ESP Underperformance Summary
This is the same information as presented in the Summary Tab.

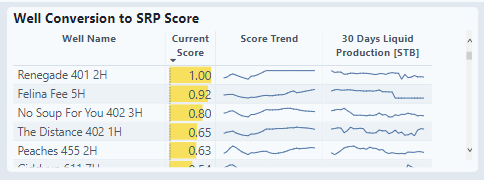
Well Conversion to SRP Score
- Based on the logic from Steward
- Current score
- Well conversion to SRP score
- Takes into account the pump intake pressure, whether a well has a tangent, and the daily production rate
- From 0 to 1. The topmost conversion candidate gets the highest score and the bottommost conversion candidate gets the lowest score. A well with no score is not a conversion candidate.
Well Conversion to SRP Calculation
Conversion score = pump intake coefficient * (liquid production rate limit – 14-day average liquid production) / liquid production rate limit
- Liquid production rate limit (oil + water) is 610 bbl/d if the well has a tangent, and 760 bbl/d if the well doesn’t have a tangent.
- The score is only calculated if the 14-day average liquid production is below the liquid production rate limit.
- Pump intake coefficient is 1 for an intake pressure of 400 psi or lower, 0.75 for an intake pressure between 400 and 550 psi, 0.5 for an intake pressure between 550 and 700 psi, and 0.2 for an intake pressure over 700 psi.
- Score trend is over the past month
- 30-day liquid production
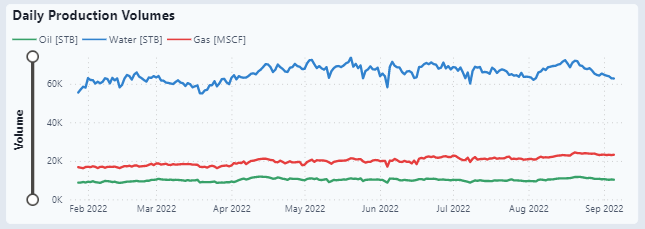
Daily Production Volumes
- Oil, gas, and water volumes
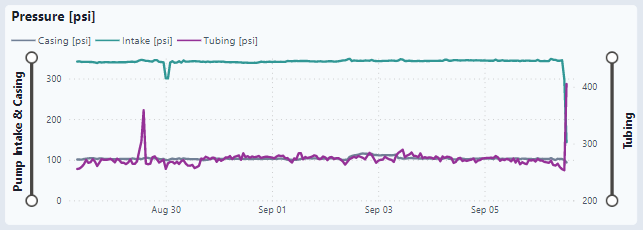
Pressure
- Casing, intake, and tubing pressures
- Hourly data for the past 10 days
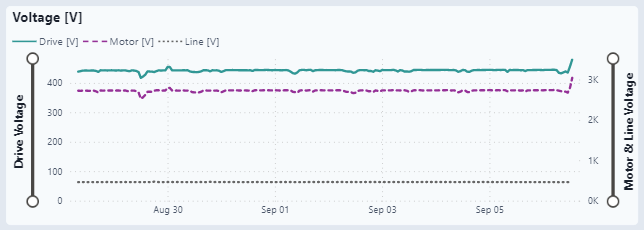
Voltage
- Drive, Motor, and Line voltage
- Hourly data for the past 10 days
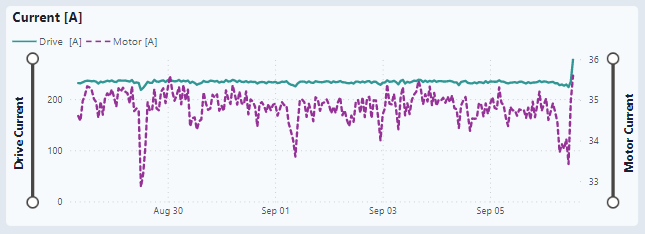
Current
- Drive and motor currents
- Hourly data for the past 10 days
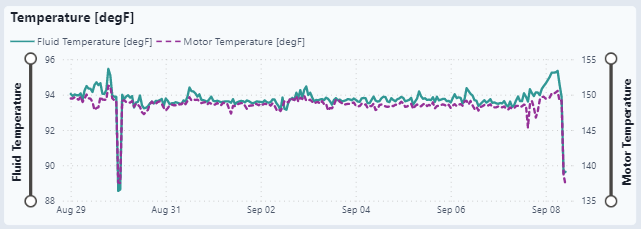
Temperature
- Fluid and motor temperatures
- Hourly data for the past 10 days
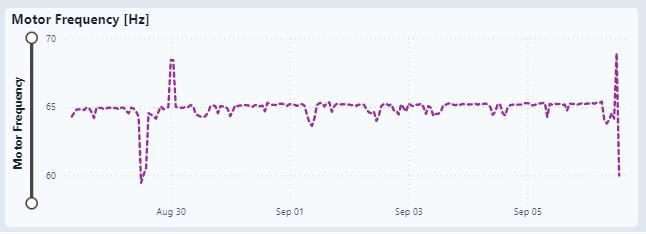
Motor Frequency
- Hourly data for the past 10 days
