This article provides a thorough understanding of the various models and user settings options within the corporate cash flow engine.
The A&D Corporate Cash Flow workflows and dashboard provide a comprehensive economic assessment of acquisition opportunities including a variety of asset and/or corporate-level cash flows such as equity requirements, debt utilization, working capital, dividends, G&A, and investor returns. Scenario analysis provides investor returns for both acquisition price sensitivities and a probabilistic evaluation of uncertainties in commodity prices, capital costs, operating costs, and production volumes.
The cash flow analysis begins with individual-well 40-year monthly production forecasts from both existing wells and drilling locations. The drilling scheduled is an input to the cash flow analysis along with many other variables as described below. Using standard oilfield economic inputs, the production volumes generate individual well cash flows that are aggregated prior to imposing the asset/corporate-level cash flow items. The culmination of the workflow is the A&D Corporate Cash Flow dashboard.
The A&D Corporate Cash Flow dashboard has three tabs:
- Summary
- Investor Returns sensitivity to acquisition price
- Probabilistic Investor Returns (and Expected Value) due to uncertainties in commodity prices, capital costs, operating costs, and production volumes
- Various Asset/corporate level KPI’s
- Quarterly Cash Flow
- Five-year quarterly cash flow table
- Field level production and cash items
- Corporate cash capital items
- Financing items
- Investor cash flows
- Per BOE metrics
- Annual Cash Flow
- 40-year cash flow table
- Summarized by year, but expandable to view individual months
- Production, field, corporate, and investor cash flows
The A&D Corporate Cash Flow workflow has several models:
There are a number of user-controlled models that are described in detail below:
- Debt/Equity Model
- Working Capital Model
- Dividend Model
- G&A Model
- Infrastructure Capital Model
- Acquisition Funding
- Acquisition Sensitivity Matrix
- Uncertainty Probabilities Matrix
- Misc. Items
The various models are calibrated and controlled by the user via one of three types of variables:
- Workspace Values (numbers),
- Signals (time-based numbers), and
- Workflow Activity Arguments (choices).
In the descriptions below each user-controlled item is qualified as being one of these three types of variables. At the bottom of this section are instructions on how to view and edit these three variable types.
Debt/Equity Model: The debt/equity model manages debt utilization with a user-defined limits to either a debt/EBITDA ratio or a % of borrowing base, or computes the debt utilization given a pre-set schedule of equity calls. As a third choice, the user can specify debt levels using a quarterly schedule. Debt is used to fund capital needs when cash flow is insufficient. If cash flow and debt capacity collectively are insufficient to fund capital needs then equity is called to make up the difference. Likewise, as debt limits decline with time, it is possible equity is called to remain within those limits. User specifies the debt interest rate. Debt utilization is computed monthly.
Any debt balance remaining at project termination will be paid first from any remaining working capital account balance and then via an equity call. If there is a positive debt balance at project termination (no debt, but rather a positive cash balance in the "debt" account) it will be paid to the investors.
The Workspace Values are found in the "A&D Corporate Cash Flow Inputs - Debt and Equity Model" workspace dictionary.
- General Variables:
- Debt Interest Rate (%): This Workspace Value is the nominal annual interest rate paid to the bank to any negative bank balances.
- Cash Balance Interest rate (%): This Workspace Value is the nominal annual interest rate paid by the bank for any positive bank balances.
- Choose Debt Limits Option: This Workflow Activity Argument offers three choices to determine how debt and equity are utilized:
- Quarterly Schedule
- % of Borrowing Base
- Debt/EBITDA Ratio
- Quarterly Schedule: The user can input pre-set equity calls using a quarterly equity schedule and then debt utilization will be computed given those forced equity calls. Using this option ignores any debt limits.
- Anticipated Equity: This Signal is a pre-set quarterly time series of equity calls. These equity calls are forced into the cash flow regardless of actual equity needs.
- % of Borrowing Base: Choosing this option maintains debt at or below a user-specified % of borrowing base. The borrowing base is recomputed twice per year in April and October using a user-specified $/BOE/D for hydrocarbon liquids and a separate $/BOE/D for natural gas. The user specifies the trailing time period to compute the BOE/D for each producing phase. The % of borrowing base limit is computed/updated quarterly and applied monthly.
- Post Acquisition Equity Calls Max % of Borrowing Base (%): This Workspace Value is a dollar amount computed using this % multiplied by the borrowing base amount. This computed values sets a not-to-exceed debt limit.
- Bank Redetermination Trailing Months: This Workspace Value is the number of trailing months to compute the average BOE/D during that time period for gas and hydrocarbon liquids (oil + condensate + NGL's). These BOE/D's are used to compute the borrowing base. These BOE/D values are recomputed twice a year, in April and October.
- Gas ($/BOE/D): This Workspace Value is multiplied by the bank redetermination Gas BOE/D to quantify the natural gas component of the borrowing base amount.
- Liquids ($/BOE/D): This Workspace Value is multiplied by the bank redetermination Liquids BOE/D to quantify the liquids component of the borrowing base amount.
- Borrowing Base ($) =
[Gas BOE/D] * [Gas $/BOE/D] + [Liquids BOE/D] * [Liquids $/BOE/D]
- Debt/EBITDA Ratio: Choosing this option maintains debt at or below a user-specified debt/EBITDA ratio. The user chooses two ratio limits, one for a user-defined initial time period, and the other after that initial time period. The ratio is computed and applied monthly and equity may be called to prevent debt levels to exceed this ratio. EBITDA is an annualized value and the user specifies how long a trailing time period is used to compute the annualized value. For instance, by specifying a trailing 3 months, the last three months EBITDA would be multiplied by 4 to return an annualized EBITDA.
- Initial Max Debt/EBITDA Ratio: This Workspace Value is applied from the effective date until the "Final" limit is imposed.
- Final Max Debt/EBITDA Ratio: This Workspace Value is imposed after a user-define waiting period. This limit can also reduce dividends to ensure dividend payments do cause debt to increase above set limits.
- Final Max Ratio Starts in Quarter: This Workspace Value is the number of quarters (minus one) after the effective date to wait before the "Final" limit is imposed. To impose the final max ratio at project inception, enter "1" for this input.
- EBITDA (Annualized) Based on Trailing _ Months: This Workspace Value is the number of trailing months used to compute EBITDA, which is then scaled to an annualized EBITDA.
Working Capital Model: The working capital model maintains a cash account to cover near-term capital needs and ARO's. This account is separate from the debt account and pays interest at a user-specified interest rate. Any money in the capital account at project termination is paid to the investors.
There are two components to computing the working capital account balance:
- A forward months of capital costs, and
- End-of-asset-life ARO's.
- Thus, the Working Capital Account Balance = Forward CapEx + Forward ARO's, with the account balance recomputed each month through a 480-month forecast.
The working capital account balance is computed monthly and is funded from cash flow, reduction in dividends, and debt/equity. At project initiation the account tends to funded by debt, equity, or cash flow, and towards the end of the asset life the account tends to be funded via cash flow and/or a reduction in dividends.
When properly calibrated, the working capital account allows end of life ARO's to be paid from the account without calling equity while simultaneously paying off any remaining debt through operating profits. There is a user-defined working capital account ramp-up period to avoid a large equity call or debt increase in the first month of the project.
The Workspace Values are found in the "A&D Corporate Cash Flow Inputs - Working Capital Model" workspace dictionary.
- General Variable:
- Working Capital Ramp-up Period (Months): This Workspace Value is the number of months starting at the effective date to build up the working capital account balance. If uncertain use 12.
- Months CapEx as Working Capital: The user specifies the number of forward months of capital costs to keep in a working capital account.
- Months CapEx as Working Capital: This Workspace Value is the number of forward months of CapEx at any point in time to hold in the Capital Account. This component can vary considerably as drilling starts and stops.
- ARO's (Asset Retirement Obligations): As individual wells reach their economic limit they are abandoned within the cash flow engine, each incurring a user-defined abandonment cost. Wells that are still operating at a profit 480 months after the effective date (40 years) are automatically abandoned at 480 months as this is the maximum time extent of the cash flow model. As such, a large ARO may occur in month 480.
Two forward looking sets of calculations create the ARO working capital account balance: one is a simple % of all future ARO's, the other a discounted time-value-of-money concept that slowly builds the final end-of-life ARO working capital account balance that may occur if a large number of wells are abandoned at project end.- % ARO's as Immediate Working Capital: This Workspace Value is a simple % of forward ARO's to add to the working capital account balance. As wells are abandoned, this computed amount will decrease over time. If uncertain, use 5%.
- PV Discount Rate for ARO Valuation (%): This Workspace Value is the annual nominal discount rate for a present value calculation of the forward ARO's. The discounted forward ARO's amount is added to the working capital account balance. This allows the working capital account balance to grow slowly into large clusters of future ARO's. If uncertain, use 10%.
- End of Life EBITDA Towards ARO (%): This Workspace Value is the % of EBITDA in a given month to add to the working capital account. This working capital account funding mechanism begins when the when the "End of Life ARO Accrues When (Fwd EBITDA)/ARO Less Than _" variable condition is TRUE. Ideally, this funding mechanism avoid the calling of equity to fund late-life ARO's and is funded by reducing late life dividend payments. If uncertain, use 10%.
- End of Life ARO Accrues When (Fwd EBITDA)/ARO Less Than _: This Workspace Value is a user-defined value resulting in TRUE/FALSE result that when TRUE, triggers the "End of Life EBITDA Towards ARO (%)" working capital account funding mechanism. If uncertain use 7.5.
Dividend Model: The Dividend Model allows profits to be paid to the investors over time. Dividend payments are evaluated each month and paid only if additional equity is not required to fund current month capital and ARO's, paid down debt balances to remain below max limits, and pay to increase working capital balances. The user has control over several inputs to manage this model as described below.
The Workspace Values are found in the "A&D Corporate Cash Flow Inputs - Dividend Model" workspace dictionary.
- Dividends no Earlier than _ Months After Effective Date: This Workspace Value is the number of months after the effective date that must occur before dividends are paid. No dividends are paid until this time period passes.
- Dividends Stop _ Months Before End of Project: This Workspace Value is the number of months before the end of life of the project during which no dividends are paid. This late-life prohibition on dividends helps ensure the working capital account balance is sufficient to pay end or life ARO's and that all debt is paid by the end of project. If uncertain use 18.
- Dividends Stop When Forward EBITDA - Debt Less Than... (M$): This Workspace Value is a forward looking debt-adjust profit estimate below which no dividends are paid. This dividend prohibition is another mechanism to help ensure any remaining debt balance is paid off via cash flow by the end of the project. If uncertain use 1,000 (= $1,000,000).
- Choose what to do with profits: This Workflow Activity Argument provides two choices of what to do with monthly profits (subject to the other Dividend Model variables):
- Deposit in bank
- Pay Dividends
- Allow Tandem Div & Debt Increase?: This Workflow Activity Argument provides two choices:
- Yes
- If Yes, then the debt utilization will remain at whatever max limit model has been selected. In this case, debt could be taken that is immediately paid out as a dividend.
- No
- Yes
-
-
- If No, then debt will not be increased in any month where dividends are paid.
-
G&A Model: The G&A (General & Administrative) Model incurs a monthly G&A expense at the corporate level.
The Workspace Value is found in the "A&D Corporate Cash Flow Inputs - Misc." workspace dictionary.
- G&A Per BOE ($): This Workspace Value is multiplied by the BOE's produced in a given month to determine the G&A dollar charge for that month. Enter as a positive number.
- Anticipated General And Administrative Expenses: This Signal is a quarterly time series of pre-set G&A expenses. The quarterly values are divided by three to convert to monthly values.
- Choose G&A Option: This Workflow Activity Argument provides three choices:
- $/BOE
- Quarterly Schedule
- Max of Schedule or $/BOE
Infrastructure Capital Model: The Infrastructure Capital Model incurs an Infrastructure capital expenditure related to plant, pipe, roads, locations, etc. These capital expenditures are in addition to drilling & completion costs and ARO's.
The Workspace Value is found in the "A&D Corporate Cash Flow Inputs - Misc." workspace dictionary.
- Infrastructure Spending Percent of Well CapEx (%): This Workspace Value is multiplied by the drilling & completion CapEx in a given month to determine the Infrastructure CapEx for that month.
- Anticipated Infrastructure Expenses: This Signal is a quarterly time series of pre-set Infrastructure Capital expenses. The quarterly values are divided by three to convert to monthly values.
- Infrastructure CapEx Based On: This Workflow Activity Argument provides two choices:
- % of Well CapEx
- Quarterly Schedule
Acquisition Funding: The Acquisition Funding has several components that incur an equity call and bank balances on the Effective Date.
The Workspace Values are found in the "A&D Corporate Cash Flow Inputs - Acquisition" workspace dictionary.
- Investor Acquisition Equity (MM$): This Workspace Value is the Expected Case dollar amount of equity to be used to fund the acquisition. This enters the cash flow analysis as an equity call at the Effective Date.
- Debt at Closing (MM$): This Workspace Value is the Expected Case dollar amount of debt to be used to fund the acquisition. This enters the cash flow analysis as the initial debt as of the Effective Date.
- Initial Working Capital (MM$): This Workspace Value sets the Initial Working Capital account amount as of the Effective Date. This amount is funded in the
- Investor ownership in Asset (%): This Workspace Value is the investor Working Interest ownership. This investor ownership is applied to the equity and dividend investor cash flows.
- Investor % of Post-acquisition Equity Calls (%): This Workspace Value allows the investor to have a different Working Interest for the acquisition itself and post acquisition equity calls. This variable also applies to dividend payments.
- Choose Acquisition Type: This Workflow Activity Argument currently provides three choices: "Base Prod Acq.", "Land Acq.", "Half-cycle Asset", and "Pre-pay". This choice determines how initial debt and initial borrowing base are determined, as well as how G&A expenses and equity are calculated.
Acquisition Sensitivity Matrix: The Acquisition Sensitivity Matrix provides five acquisition values scaled from an Expected Case acquisition price using user-defined multipliers. For each of the five acquisition values, the debt component of the acquisition funding is held constant and the equity is computed as Equity = Acquisition Cost - Debt. Then each sensitivity case is evaluated using the Expected Case Commodity Prices and Expected Case CapEx/OpEx/Prod multipliers to determine Investor returns. An example sensitivity matrix is shown below. The results are qualified as "Unstressed" because it uses the Expected case inputs for CapEx/OpEx/Prod and Commodity Prices. Expected case values are described in the Uncertainty Probabilities Matrix section.

The Workspace Value is found in the "A&D Corporate Cash Flow Inputs - Economics Sensitivity Settings" workspace dictionary.
- Acq. Cost Multiples for Unstressed Before-Tax Investor Returns Vs. Acquisition Price: This Workspace Value contains five numbers separated by commas (no spaces). These five numbers are multipliers applied to the acquisition cost that was input as a workspace value, which is also regarded as the Expected Case acquisition cost. Typically the Expected Case acquisition cost is included in this sensitivity by including a multiplier of 1.0. An example of five multipliers: 0.8,0.9,1.0,1.1,1.2.
Uncertainty Probabilities Matrix: The Uncertainty Probability Matrix is a 3X3 matrix to evaluate a mix of Downside, Expected, and Upside cases for Commodity Prices and CapEx/OpEx/Production.
For CapEx, OpEx, and Production, multipliers are applied to the input values and the individual component multipliers are grouped into three cases in order to reduce the overall number of case. Thus, each case has a set of three multipliers, one each for CapEx, OpEx, and Production. Typically the Expected Case will use a multiplier set of 1.0, 1.0, 1.0.
The Commodity Price cases don't use multipliers, but rather reference Scenarios. Each Scenario contains a user-input and user-named commodity price forecast. Any number of Scenarios can exist in a workspace, and the user references three of those Scenarios for the probability matrix.
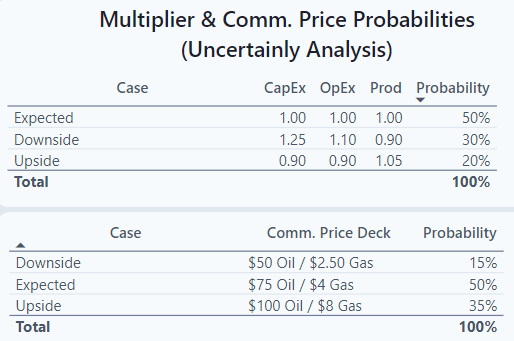
Below is an example of the Probability Matrix inputs. Note that each case has user-input probabilities. The only criteria is that the probabilities sum to 100% for each of the CapEx/OpEx/Prod cases and Commodity Price cases.
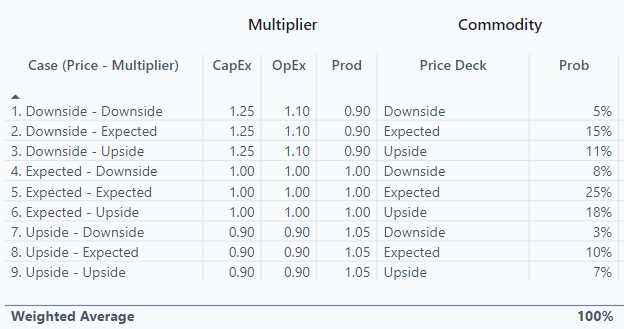
The 3X3 probability matrix workflow evaluates all the combinations of CapEx/OpEx/Prod & Commodity Price cases, creating nine combinations. The resulting nine cases, shown below, each have a probability computed as the product of the individual case probabilities, and for the nine cases sum to 100%. These probabilities are used to compute a probability-weighted average result. Statistically, this is properly called Expected Value Economics.
The Workspace Values are found in the "A&D Corporate Cash Flow Inputs - Economics Sensitivity Settings" workspace dictionary.
- CapEx, OpEx, Prod Multipliers: These Workspace Values each contain three numbers separated by commas (no spaces) to be used as multipliers for CapEx, OpEx, and Production. The underlying unadjusted CapEx, OpEx, and Production volumes are inputs into the cash flow engine. The multipliers are applied, left to right, to CapEx, OpEx, and Production. A multiplier of 1.25 would increase the input value by 25%.
- Expected Multipliers (CapEx, OpEx, Prod): The multipliers for the Expected Case usually are set to 1.0. For example: 1.0,1.0,1.0.
- Downside Multipliers (CapEx, OpEx, Prod): The multipliers are typically above 1.0 for CapEx and OpEx, below 1.0 for Production.
- Upside Multipliers (CapEx, OpEx, Prod): The multipliers are typically below 1.0 for CapEx and OpEx, above 1.0 for Production.
- Multiplier Probabilities: This Workspace Value provides the probabilities of the three multiplier groups (CapEx, OpEx, Prod). The sum of these probabilities must equal 1.00. For example: 0.30,0.50,0.20.
- Commodity Price Scenarios: These Scenarios each contain user-input commodity prices and a user-defined Scenario name. Any number of Scenarios can exist in a workspace, and the user references three of those Scenarios for the probability matrix.
- Expected Hub Price Scenario Name: This value must match the name of an existing Scenario. As an example: $75 Oil / $4 gas.
- Downside Hub Price Scenario Name: This value must match the name of an existing Scenario. As an example: $50 Oil / $2.50 gas.
- Upside Hub Price Scenario Name: This value must match the name of an existing Scenario. As an example: $100 Oil / $8 gas.
- Commodity Price Probabilities: This Workspace Value provides the probabilities of the three Commodity Price Scenarios. The sum of these probabilities must equal 1.00. For example: 0.15,0.50,0.35.
Misc. Items: There are several user-specified misc. items that are used in the A&D workflows.
- Run Expected Case Only?: This Workflow Activity Argument, when set to True, restricts the economics runs to only the expected case. Restricting to the expected case is often used to reduce run times when making initial evaluations of multiple potential drilling schedules. To run all the sensitivity cases, set to False.
- Effective Date: This Workspace Value defines the Effective Date of the evaluation, entered as mm/dd/yyyy. Production, cash flows, and all economic measures are from the Effective Date forward. No production or cash flows prior to the effective date are considered in the economic analysis.
- A&DEconomicsHierarchyName: This Workspace Value is the hierarchy name to be used in the A&D Workflows. The default name is "A&D Economics Hierarchy" but users can create their own hierarchies and names. The hierarchy is the list of wells to be processed in the A&D economic analysis.
- A&DEconomicsParentEntityType: This Workspace Value is the entity type of the parent entities in the A&D Economics Hierarchy specified by the A&DEconomicsHierarchyName workspace value. The default type is "Company".
- EconomicsAnalysisMonths: This Workspace Value is the number of months of duration of the economic analysis. The first month is the month of the Effective Date. The default value is 480.
- EconomicsHierarchyName: This Workspace Value is the hierarchy name used for the Candidate Screening workflows. The default name is "A&D Candidate Screening" but users can create their own hierarchies and names. The hierarchy is the list of wells to be processed in the Candidate Screening workflows.
- EconomicsParentEntityType: This Workspace Value is the entity type of the parent entities in the Candidate Screening Hierarchy specified by the EconomicsHierarchyName workspace value. The default type is "Company".
- YearlyInflationRate: This Workspace Value is the annual nominal inflation rate that is applied to capital and operating costs. Enter as a percentage.
The A&D Corporate Cash Flow workflows require the user to enter values and make choices:
The various models incorporate user-defined inputs stored as Workspace Values, Signals, and Workflow Activity Arguments. The Workspace Values are specific values entered by the user to be used in the workflow, such as the Effective Date. The few user-entered date-based values used in the workflow, such as equity calls by quarter, are stored as signals. The Workflow Activity Arguments are options chosen by the user to run specific calculations, such choosing to have the maximum allowable debt based on debt/EBITDA ratio or % of borrowing base.
Workspace Values:
Almost all of the required workspace values can be found in a single pop-up window. Follow the steps below to access that window.
- Select the Workspace Values gear icon in the lower left corner of the window.

- Then selecting "Packages" and selecting the "A&D Corporate Cash Flow" package

- Then selecting Configure in the upper right corner of the pop-up window.

- You will now see several sets of Workspace Values used in the A&D Corporate Cash Flow workflows in a pop-up window.
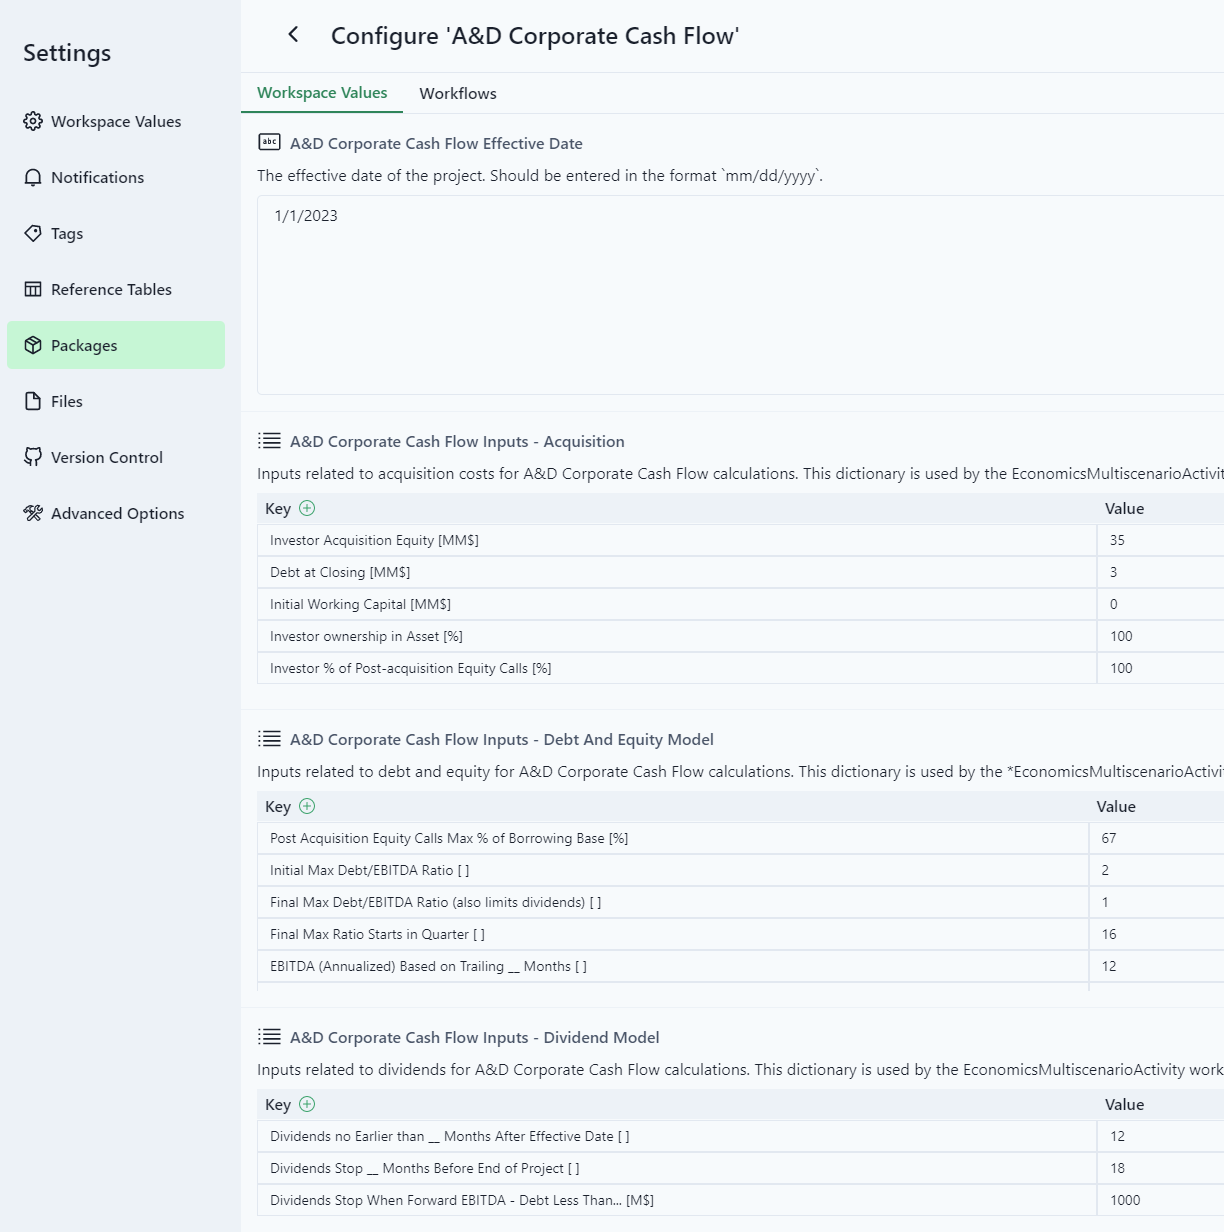
- Change the Workspace Values by entering the desired values and click
 in the lower right corner of the pop-up window.
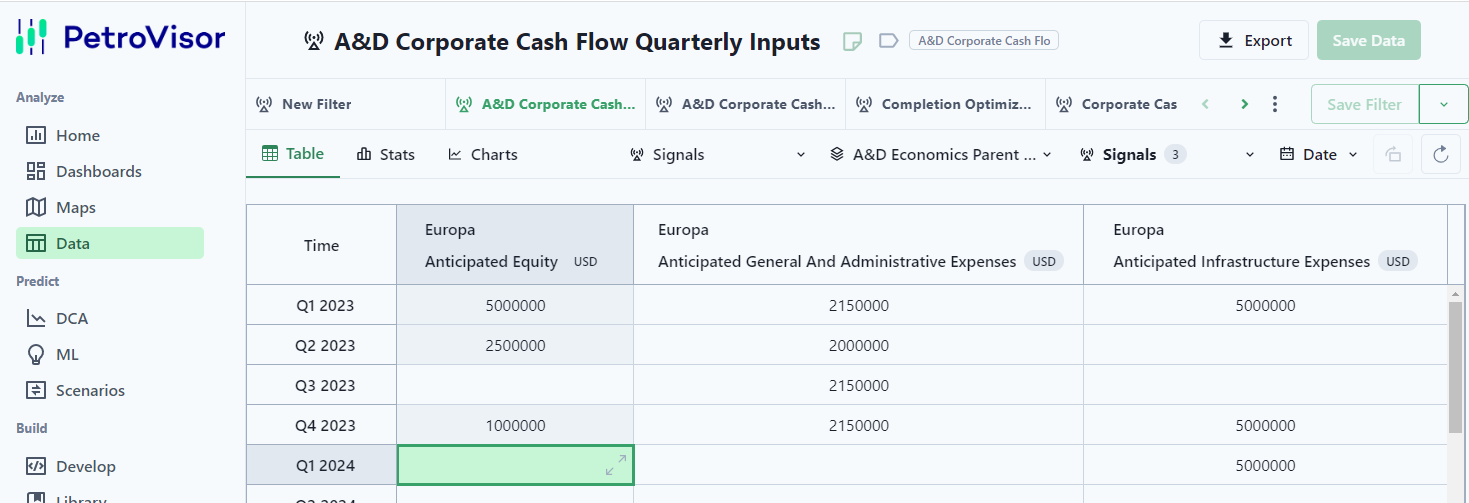
- There are three user-entered quarterly values that may be used in the A&D workflows:
- Anticipated Equity
- Anticipated General And Administrative Expenses
- Anticipated Infrastructure Expenses
- These values may be viewed and edited in the Data section, "A&D Corporate Cash Flow Quarterly Inputs" filter. Enter/modify values as desired and press the
 button in the upper right of the screen.
- The workflow activity arguments for A&D can be found in the "A&D Corporate Cash Flow" workflow, "External Activities" script. By selecting the External Activities script in this workflow, a number of Activity Arguments are exposed as shown below.

- Clicking on the activity argument of your choice opens a window with the available options. As an example, clicking on "Choose Debt Limit Options" provides a list of those options.

- After making your selection, press the
 button in the upper right corner of the window.
The A&D Corporate Cash Flow workflows require these inputs:
- Commodity Prices: Via Hub Commodity Price Scenarios.
- General Economic Inputs: Via the 'Economics Parent Static Signals' Data View.
- Well Cost Model: Via the 'Completion Optimization Capital Cost Inputs'
- Drilling Schedule: Via the Scenario Planner.
- Various Settings:
- Effective Date
- Interest rates
- Inflation rate
- Run Expected Case Only
Create a Drilling Schedule Using The Scenario Planner:
The drilling schedule consists of a set of 'opportunity' entities with associated production forecasts and capital costs. The creation of these opportunity entities and scheduling of their production vs time can be generated using the Scenario Planner.
The scheduler allows a single well production vs. time history/forecast to be cloned and shifted in time to start on a scheduled date. If the Completion Optimization App has been run, the individual cases are stored as opportunity entities and can be cloned to create the drilling schedule. The instructions below assume the Completion Optimization cases will be the source of production forecast used in the drilling schedule.
- To create new drilling schedule:
- Select the Scenarios area
- Select the Add Scenario button
- Select Scenario Planner
- Choose the Entities drop-down box
- Choose the filter icon
- Turn on the Opportunities option
- Select the 'Only' option on the Filters/Opportunities window
- Close the Filter window
- Select the entities you wish to use/clone, and close the entities window.
- Select the signals you wish to include in the cloning process via the Signals dropdown box.
- Select the desired scope via the Scope dropdown box. The default scope is A&D Corporate Cash Flow Economics.
- Under the Configure Entities section, select the entities you would like to clone:
- Selecting multiple entities will create the same schedule from each cloning parent entity. If you wish to have different schedules for different cloning parents, schedule each cloning parent separately.
- Select the Configure button to bring up the Configure Entities window. Select/set the cloning parameters and select the Clone button.
- Save the Scenario via the Add Scenario button, providing a name and selecting the Save button.


Initialize the Hub Commodity Price Scenarios:
Before the automated workflows can be run, three hub commodity price Scenarios must be created and properly referenced in the Workspace Values. These three Scenarios can be named as desired.
- To create new Hub Commodity Price Scenarios:
- Select the Scenarios area
- Select the Add Scenario button
- Select the Empty Scenario option
- Enter a name in the 'New Scenario Name' pop-up window.

- To populate the Hub Commodity Price Scenarios with flat commodity prices:
- Select the Develop area.
- Type 'Scenario' in the search bar.
- Select the 'A&D Economics Load Scenario Data' script.
- In the Script section of the window scroll down to the 'Time Data' and enter the desired values for hub oil price and hub gas price.
- Select the dropdown button next to the 'Preview' button.
- Select the 'Run With Options' button.
- In the 'Run Options' pop-up window select 'Save Saving columns' in the general section.
- In the 'Run Options' pop-up window select the 'Scenarios' option.
- In the 'Run Options' pop-up window select the Scenario you wish to populate via the Scenario dropdown box.
- Select the 'Apply and Run' button.


- To populate the Hub Commodity Price Scenarios with time-dependent commodity prices:
- Load the commodity prices via a P# script.
- Perform steps 5 - 10 in the flat commodity price section above.
Running the A&D Corporate Cash Flow workflows:
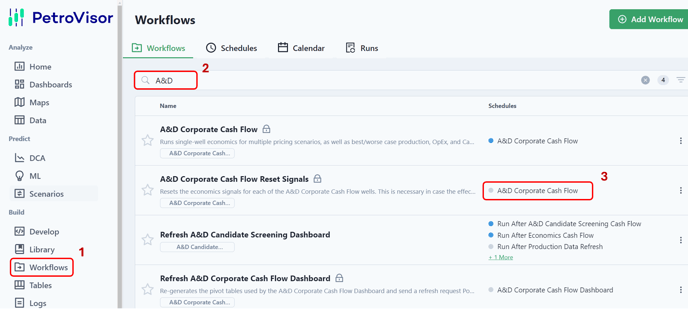
- To run the A&D Corporate Cash Flow workflow:
- Select the "Workflows' navigation area.
- Type "A&D" in the search bar.
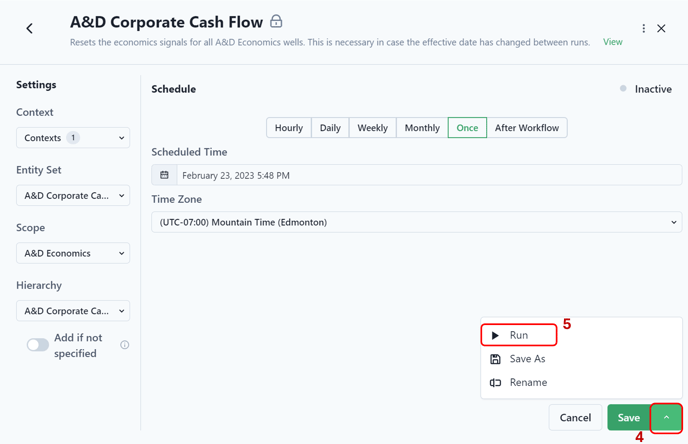
- Select the "A&D Corporate Cash Flow" schedule from the "A&D Corporate Cash Flow Reset Signals" workflow. This will bring up a settings/run window for that workflow.
- Select the dropdown arrow next to the Save button.
- Select Run from the pop-up window.
- This will run three workflows:
- A&D Corporate Cash Flow Reset Signals
- A&D Corporate Cash Flow
- Refresh A&D Corporate Cash Flow Dashboard
