![Weatherford-150.jpg]](https://hs.weatherford.com/hs-fs/hubfs/Weatherford-150.jpg?height=50&name=Weatherford-150.jpg)
Overview
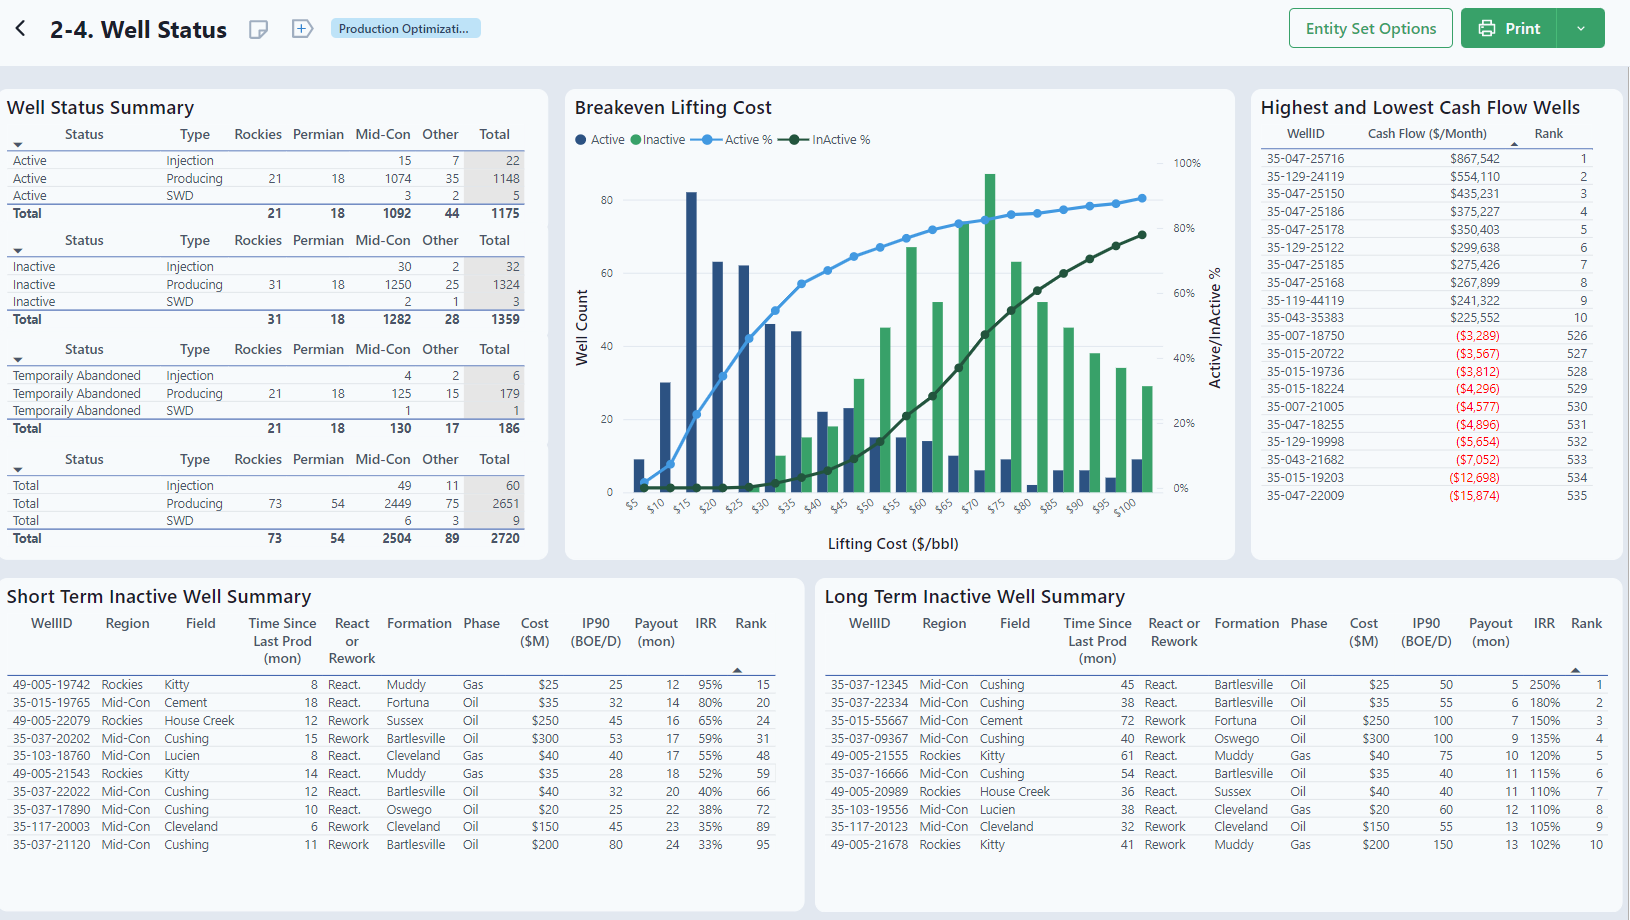
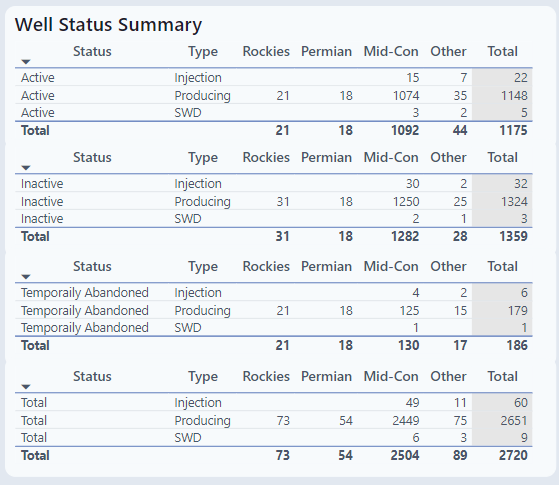
Well Status Summary
This table lists wells by active, inactive, and temporarily abandoned by region.
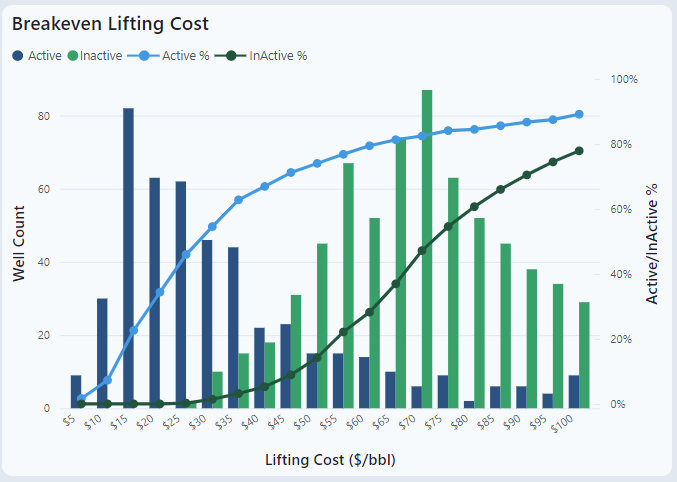
Breakeven Lifting Cost
The Breakeven histogram details the lifting cost (and price of oil) of wells by active vs. inactive. As the lifting cost decreases, the number of wells should increase.
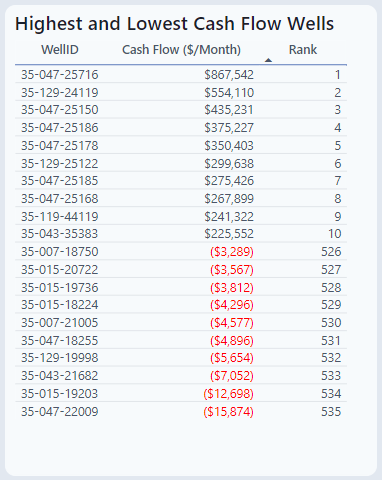
Highest and Lowest Cash Flow Wells
This table lists the top 10 and bottom 10 wells according to cash flow. Notice that the lowest cash flow values are negative in the example.
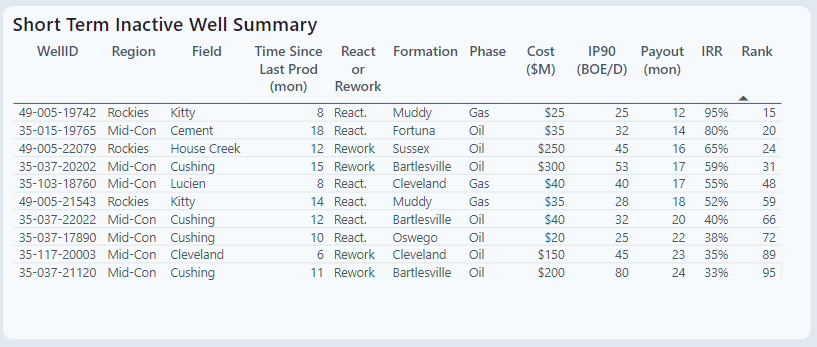
Short Term Inactive Well Summary
Short Term (time determined by client) Inactive Well Summary ranks wells by IRR. This ranking enables the engineer to quickly determine which wells to reactivate.
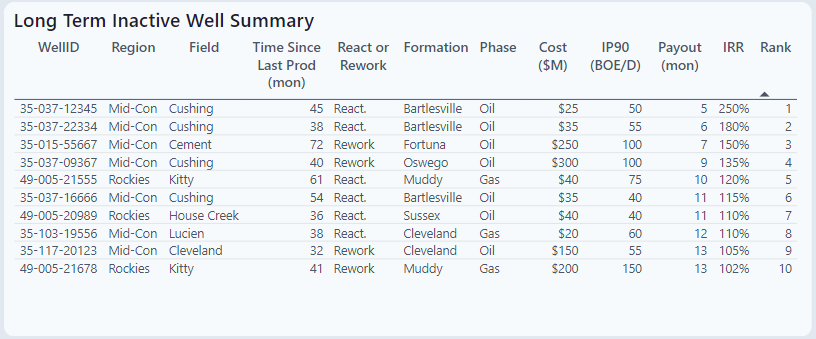
Long Term Inactive Well Summary
Long Term (time determined by client) Inactive Well Summary ranks wells by IRR. This ranking enables the engineer to determine if a well should be reactivated, abandoned, or sold.