![Weatherford-150.jpg]](https://hs.weatherford.com/hs-fs/hubfs/Weatherford-150.jpg?height=50&name=Weatherford-150.jpg)
Training Guide
- Navigate to Signals.
- Click on Cumulative Gas Production.

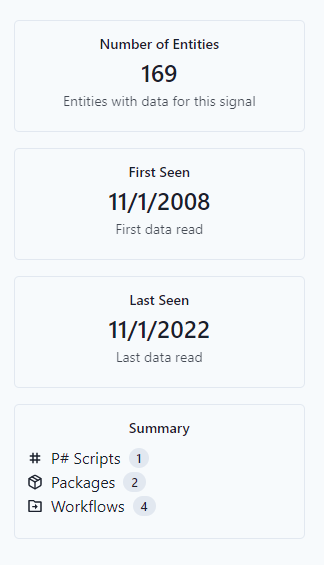
Notice that the number of entities is correct, and the date range seems reasonable.
The next step is to view the data.
- Navigate to Data.
Use the following filter information:
- Time (Numeric)
- Entities: Select the first 4

- Signals: Cumulative Gas Production

- Date: Scope 2008 - 2022

- View as a Chart.

- Change the Signal to view Gas Production Rate.

To further verify the workspace data, check the tags for a specific entity
A Tag has a name, a label, a start date, and an end date. They are used to mark changes in condition or behavior in a well.
- Navigate to Entities.
- Select an Entity.
- Select the Tags tab.

Notice that this well became a gas producer on 11/1/2008 and continued to be a gas well through the data.
Tags are used in scripts to condition calculations.